
User`s guide


Section 3 – Displaying and Using the Summary Screens
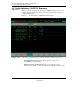
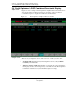
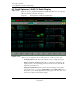
3.6 Profit Optimizer’s DQP Combined Constraint Display
1/00 Profit Optimizer User's Guide 43
Honeywell Inc.
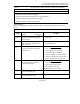
Table 3-7 Profit Optimizer’s DQP Combined Constraint Control Functions
Use the Profit Optimizer’s DQP Combined Constraint Screen for These Tasks . . .
Operator and Engineer
• Displaying every combined constraint in the optimizer.
• Displaying the combined constraint descriptions, status, and operating values.
• Displaying and setting combined constraint high and low limits.
• Displaying and setting the combined constraint setpoints.
Field Descriptions
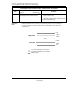
Table 3-2 Profit Optimizer’s DQP Combined Constraint – Understanding the Fields and Using the
Targets
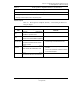
Profit Optimizer’s DQP Combined Constraint – Field Descriptions and User Notes
Field
Description
Field Type Default Access
User Notes
Comb
Constraints
Target OPER
Description that characterizes the variable's
function or location.
• Select the target to call the Combined Constraint
Detail screen.
Stat
Read-Only No Access
Status. GOOD, DROP, PRED, CRIT, INIT,
WDUP, or INAC.
See CV, MV, DV, BDV and CC Statuses in Section 2.2
for status descriptions.
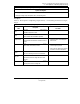
Value
Read-Only No Access
The value of the combined constraint at the
current execution.
Values Display In Color
• Cyan = Measured value is within limits.
• Yellow = Measured value is near limits.
• Red = Measured value is violating limits.
• Half Cyan = Predicted value is to be within limits.
• Half Yellow = Predicted value is to be near limits.
• Half Red = Predicted value is to violate limits.
SS Val
Read-Only No Access
This column displays the Profit Optimizer
predicted steady state values.
Values Display In Color
• Cyan = Predicted to be within limits.
• Yellow = Predicted to be near limits.
• Red = Predicted to violate limits.
See Application Notes for an illustration.
Lo Limit
Target ENG
Low end of the operating range.
Hi Limit
Target ENG
High end of the operating range.