
User`s guide


Section 3 – Displaying and Using the Summary Screens
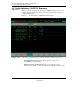
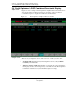
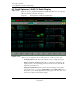
3.3 Profit Optimizer’s DQP MV Summary
1/00 Profit Optimizer User's Guide 37
Honeywell Inc.
Application Notes
In Profit Optimizer, this is what near limits means and how colors display for
predicted MV values that are within limits or near limits:
Hi
g
h Limit
Low Limit
0.1% Inside Limit
(
Near Constraint
)
1.0% Outside Limit
(
Near Constraint
)
C
y
an
Yellow
Yellow