
User`s guide

Section 3 – Displaying and Using the Summary Screens
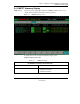
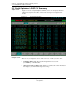
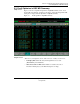
3.2 Profit Optimizer’s DQP CV Summary
1/00 Profit Optimizer User's Guide 33
Honeywell Inc.
Table 3-1 DQP CV Summary Control Functions
Use the DQP CV Summary Screen for These Tasks . . .
Operator and Engineer
• Displaying every CV in the optimizer.
• Displaying the CV descriptions, status, and operating values.
• Displaying CV high and low limits.
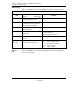
Field Descriptions
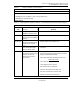
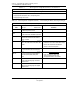
Table 3-2 Profit Optimizer’s DQP CV Summary – Understanding the Fields and Using the Targets
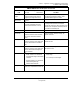
Profit Optimizer’s DQP CV Summary – Field Descriptions and User Notes
Field
Description
Field Type D
e
User Notes
APL
Read-Only
The RMPCT application number.
CV #
Read-Only
The CV number within the RMPCT
application.
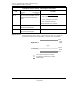
CV Description
Target
Description that characterizes the
variable's function or location.
• Select the target to call the CV Detail screen.
Stat
Read-Only
Status. GOOD, DROP, PRED,
CRIT, INIT, WDUP, or INAC.
See CV, MV, DV, BDV and CC Statuses in Section 2.2 for status
descriptions.
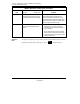
Value
Read-Only
The value of the CV at the current
execution. This can be the
measured process value or a
predicted value.
• Dashes display when the source value is bad or unavailable for
longer than the number of bad values allowed. See the Detail
display [# OF BAD READS ALLOWED].
• See the Detail display for the [SOURCE] point of this value.
Values Display In Color
• Cyan = Measured value is within limits.
• Yellow = Measured value is near limits.
• Red = Measured value is violating limits.
• Half Cyan = Predicted value is to be within limits.
• Half Yellow = Predicted value is to be near limits.
• Half Red = Predicted value is to violate limits.