Commander Operations Manual C10e/C10e-I/C10p/C10p-I 1
FCC Caution and Warnings Caution: Before attempting to connect or operate this product, please read the label on the top and bottom. Note: This equipment has been tested and found to comply with the limits for a Class A digital device, pursuant to Part 15 of the FCC Rules. These limits are designed to provide reasonable protection against harmful interference when the equipment is operated in a commercial environment.
Before You Start: Limitations of Liability/ Disclaimer of Warranty/ Safety Instructions Limitations of Liability: This Commander Instruction and Operation manual is provided “as is” without warranty of any kind, either expressed or implied. This includes but is not limited to: implied warranties of merchantability, or fitness for any reason or purpose. This limitation also includes noninfringement of any third party’s rights.
Trademarks and Registered Trademarks/ Warnings Precautions: 1. Logs are held in Commander’s volatile memory. Any loss of power will erase all log data. 2. As Commander is a computer device, it is strongly suggested that it be powered from devices which offer EMI and RFI protection and power back up, 3. Do not operate Commander beyond its specified temperature, humidity, or power source ratings.
Table of Contents Overview Model Numbers ....................................................................................................7 Operation...............................................................................................................8 Front Panel ............................................................................................................9 Rear Panel ...........................................................................................................
Switch Switch flow .........................................................................................................82 MAC Tables & Ageing .......................................................................................84 Spanning Tree Protocol.......................................................................................86 VLAN Setup .......................................................................................................88 Bandwidth Management .........................
Overview Model Numbers Commander C10 series is available as four model numbers: C10e: Is an all copper version and operates within a Commercial temperature range. Its operating temperature range rating is 14F – +140F (-10C to +60C) C10e-I: Is an all copper version and operates with an Industrial temperature range.
Operation Commander is an IP Security Commander’s Center designed for any application that requires network switching, network traffic monitoring and protecting system components from failure due to temperature, humidity or the loss of air flow. Commander’s unique design also provides interfaces for hard contacts and control of external auxiliary triggers. Commander Probes are intelligent.
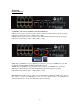
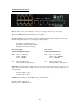
Commander Front Panel Power: There are two power indicators, one for power supply and one for power status. The Power LED illuminates green when power is applied. The Alarm LED is green for normal operation and will turn red for alarm conditions on any of the internal temperature monitors or power supply voltage monitors.
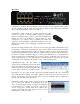
Data Ports A (RS232) & B (RS485) LEDs: There is one Bicolor LED per port. (Port A = RS232, Port B = RS485). When the Tx of the port is active the LED will turn on Red for 0.25 seconds. When the Rx of the port is active the LED will turn on Green for 0.25 seconds. Rx: = Data from TCP to Serial Tx: = Data from Serial to TCP Probe Status & Alarm LED’s: Commander operates by sensing the number and location of probes upon power up. Those ports with sensor probes connected will be indicated on the front panel.
Commander Rear Panel ! 1 2 3 4 5 6 1. Power connection: 100-240 VAC @ 50 to 60 Hz. 2. Alarm Inputs 1, 2: A potential free contact closure can be used as an alarm input. These may be programmed as Normally Open or Normally Closed. 3. Auxiliary Outputs 1, 2: This port is triggered by the alarm inputs, sensor warning and alarms as programmed by the operator. Active durations are also programmable. In addition Auxiliaries can be manually turned on or off via the web browser interface. 4.
RS485 Connector 1 Common 2 IN - 3 IN + 4 OUT + 5 OUT - 6 Common 1 - 6 The RS232 connections is a standard DB9 DTE configuration Installation To install the Commander it is first necessary to mount the rack flanges to the unit. Two mounting flanges are supplied with each Commander. For flush mounting, install the ears with the #10 flathead screws provided There are two rack mounting options. A single Commander can be installed in a rack using the half rack mounting kit C10-HRM.
Probe Placement Temperature and Humidity Reading: (P-TA and P-TAH) Place the probe between 1-3 inches from the device so that heat will flow directly towards the sensor. Probes can be directly mounted to a chassis using double sided tape or Velcro. For Airflow Read ing: Place the probe between 1-3 inches from the device so airflow will flow perpendicular to each sensor tip. For Rack Mounting: AFI provides an optional rack mount kit P-RM.
Commander’s status can be viewed via LED’s located on Commander’s front panel or via a Graphic User Interface provided as part of Commander’s web services. As some operators may also want to view current Sensor probe status and not just exceptions, a Sensor Status mode is provided. Using this mode the front panel probe LED’s will indicate status in the same method as the probe itself. Actual response will be dependent on your network speed.
Web Browsers Commander does not require an Active X component be loaded on the client computer. As such Commander is compatible with most web browsers. However, since programming within Web browsers is not under the control of American Fibertek, the company cannot be held responsible for the performance of Commander under any given browser. In addition Graphic User Interface screens and their operation may change from browser to browser.
Screen Refresh and Event Warnings Commander contains a built in web server. No additional software is required to monitor individual Commanders. There are two ways to monitor Commander activity. Method one is to view a complete .html web page. This allows an operator with the appropriate permission levels to view different pages and set ups. All statuses can be monitored by viewing Commander’s “Status View” page. Up to 10 Clients can individually monitor an individual Commander.
Event Pop Ups Many of the functions in Commander operates by means of pop ups. Activating a function in Commander only requires a single mouse click. If more than one mouse click is used or additional browser functions are opened the potential exists for the pop ups not to appear the in screen foreground. Under normal operations the pop up will appear in the screen foreground over the main view. In all cases the pop up will appear in the tool bar.
Reset to Factory Defaults If the Master Admin password is changed and lost for any reason, the only recovery method is to reset Commander back to its defaults. For this reason the following precautions should be taken: 1. Keep a record of all user names and passwords. IT and Security user names and passwords are maintained by and can be accessed by the Master Admin. However the Master Admin user and password is not. 2. Follow the procedures to download and save programmed settings.
Resetting Commander’s using the RS 232 Port In some cases it maybe necessary to reset Commander using the RS 232 Port in order to recover from incorrect IP settings. ! To reset the RS232 Port: Connect to the RS232 port with a Null Modem cable. Set the computer’s terminal program to 115200/8/N/1. Push the reset button for 4 seconds. The Port B Led will go Orange when the button is pressed and then Red after the 4 seconds.
Recovering IP Address when DHCP Is Used Commander has the ability to be programmed with a fixed IP address and operate in systems using DHCP. In the latter case Commander’s IP address will change according to the IP address assigned to it by that system’s DHCP server. In order to inform the operator of any such change in its IP address, Commander will send the new IP to the email address programmed in the Global Settings. Please note: The programming of Global Settings is restricted to the Master Admin.
LED Startup Sequence On power up, Commander will go through a boot process. The front panel LED’s will display different colors and states as Commander goes through these steps. The following is the normal sequencing of these LED’s after power is applied: 1) Power LED green: power is applied.
UTC Time Time zones, "UT" and "GMT" are indications of "Universal Time" and "Greenwich Mean Time" respectively and are both semantically identical to "+0000". As Commander can exist on a network anywhere in the world, it is important to know its time zone location. Please note that logged dates and times reflect the date and time at the actual location of the Commander and not at the viewing client.
System Access System Access Levels Commander has three main access levels and seven total login levels. The main access levels are Master Administrator, IT Administrator, and Security Administrator. The Master Admin can create user names and passwords for all levels. The IT Admin can create user names and passwords for all IT levels and the Security Admin can create user names and passwords for all Security levels.
Master Admin Menu Commander has several modes for operation and set up. All of these can be found in the operating menu bar which appears on all screens. The menus available are defined by the security level assigned to an individual user. Operator Set Up is restricted to the assigned security level access Each sign in screen contains a “Welcome” message which details the permissions grated to that security level.
IT Access Levels 26
Security Access levels 27
Logging In and Out Using a web browser enter the Commander’s IP address (default IP address in the case of first login) as the URL and the log in screen will appear. If the location has been previously titled, that name will appear. Entering the User Name and Password will define your access level to the Commander. After entering your user name and password, press Submit. If a mistake is made, press Reset and reenter the user name and password. The Master Administrator default username is “Admin”.
Programming Operator Setup When first accessing Commander by entering the correct IP Address, Commander will display opening screen for entering User Name and Password. This screen also display the general permissions for Master Users (Admin), Security Users and IT Users. Signing in as Master Admin will display the Master Admin Welcome screen outlining the general permission levels. The Master Admin can assign operator user names and password for all security levels.
Adding an Operator Commander allows each of the three Administrators, and seven total security levels. The main security levels are: Master, IT and Security to assign up to 10 User Names and Passwords for each category. Assignments can only be made at the authorized level and below. An IT Admin cannot make assignments in the Master and Security categories. A Master Admin can assign User and Passwords for any access level.
Next Check the FTP and/or SMTP providing that user permission to FTP and/or Email. Fill in the Email address. This will be the specific email address for that operator. All functions with email capacity will send their emails to that address. FTP user name and Password is the same as the user name and password. Click the Add User icon and a pop up box will appear asking to confirm your decision. Clicking OK will complete the process of adding the operator.
Global Settings Internal Values and Warnings Commander monitors its own internal temperature and voltage values. Operating at too high or too low of these values can result in decreasing Commander’s performance or turning Commander off. Extreme operating conditions could further result in damaging Commander. The best precaution against environmental damage to Commander is to properly install and operate the unit.
Name and Location Fill in the name and location of your Commander. These names will appear in all logs, emails and records. Global Settings: Temperature Use the drop down menu to select Fahrenheit or Celsius temperature scale. Warning-Alarm Delay Commander probes sample environmental conditions once every 10 seconds and verify conditions after 3 samples or 30 seconds. This delay is programmable and determines the duration a condition must be valid prior to taking any action.
Modify When the Global Settings changes are completed, click the Modify button. A pop up will appear asking you to confirm your choice. OK will enter the settings. Cancel will return the screen to the previous mode. Global Settings: Modify Complete When Commander has completed the modification it will issue a Pop Up.
Firmware Upgrade Master Admin Firmware Setup Clicking on the Mode for Firmware Setup will display the Firmware Setup screen which allows new firmware to be loaded updating Commander. The screen will also show a history of the most recent updates Firmware Update Browser Button Clicking on the Browser button will open up the Browser located on the client computer. The file to be uploaded must be located on the client computer. Select the file using the same methods as any Windows ™ program.
File Doesn’t Match If the upgrade file is not accepted, the following alert will appear. Clicking OK will return to the previous screen and allow the selection process to be repeated. Completing the Upload Process If the correct file is selected a time bar will appear at the upper end of the screen indicating the upload is in process. Successful completion of the Upload will be indicated by the following alert box.
Save / Restore Configuration Clicking the Save button will open up the Windows™ Save As screen on the client computer. The operator only needs to select the destination folder Save If the save button is selected the system will automatically create the file and downloaded to the previously selected destination folder. The .tar extension will automatically be added after which the operator can elect to change the file name. Caution only file names with .tar extensions can be uploaded.
Save/Restore Feature: Restore: File Restored When the Restore function is completed the “File Restored” alert box will appear.
IP Settings Default IP Settings Commander’s default settings are displayed to the right. DHCP is set to off in the default settings and the default HTTP port is 80. IP Address: 192.168.10.11 Subnet mask: 255.25.255.0 Gateway: 192.168.1.1 HTTP Port This is the port used to access these setup screens via a web browser. This setting is restricted to certain ports as displayed on screen.
SMTP Settings Simple Mail Transfer Protocol setup is required for emails to be sent from the Commander. There are two methods provided. An internal SMTP server may be used, or Commander can connect to a mail server using login account credentials. Internal SMPT server will act on its own, connecting to other mail servers. However, other servers may not recognize Commander as a legitimate internet mail server and may refuse connection. External SMTP server will setup Commander to act as an email client.
Time & Date The Time/Date function defines the formats for date and time, the time zone commander is functioning within, and the current data and time. Start by setting the Date and Time Display Time/Date Setup: NTP Active Commander’s time reference can be set by NTP (Network Time Protocol). If NTP is active the time date setup will have the appearance to the right. You will not be able to set a new time or date.
NTP Commander provides three settings: different NTP None: NTP is not active. Commander’s internal real time clock is used as the reference. When using the internal clock as reference, please make certain the time is correct. Accept NTP Broadcasts: Commander will accept NTP broadcasts. Use this setting if you are using a system clock. Poll NTP Server: Commander will Poll a NTP Server at a specific IP address. This setting can be used to poll at external NTP source located on the Internet.
Firewall Firewall Setup: A-Opening Screen Firewalls protect Commander from access from outside sources that could data access without authorization. Firewall Setup: Adding an Address To add an address, type the address in the “Mask IP Address” box. Mask subnet addresses are based on series of numbers 0-32 with 0 representing the full range. Type in the number that corresponds to your network. Click “Add” a pop up box will appear asking you to confirm your settings.
Status View This view allows all users the ability to see both the Commander’s internal and external status. A description of the information displayed is as follows: 2 1 2 4 3 1. Header: A. Access Level as defined by the operator user name and password. B. Day, month, time, and year with reference time zone. In the header time is always displayed in 24 hour format regardless of the actual time display setting. C. Product name and model number. D.
5 5. Internal Settings: In addition to monitoring external conditions, Commander monitors itself by reporting internal voltage and temperature conditions. An internal fan will activate as determined by high temperature conditions avoiding continues operation and extending its usage life span Internal Triggers: Commander will trigger an internal alarm when any of the following conditions exist: CPU I/O voltage is less than 2.25 volts or greater than 2.75 volts. CPU core voltage is less than 1.
Port Status Color Code: Green=Normal connection and data flow Amber=Port is in warning state Red=Port is in alarm state Grey with red X =Port is disabled Alarm LEDS: (Hard Contact Inputs) Gray or no color for inactive stat Red in active state (active duration is dependent upon auxiliary duration setting.) Auxiliary LEDS: Gray or no color for inactive state Red in active state (active duration is dependent upon auxiliary duration setting.
IP Address conflict notification In the event the network has a duplicate IP address on the same LAN, Port A will flash amber as long as the condition exists. Commander will check this network condition each minute. When the condition is no longer present the LED will return to the Off state. When multiple Scouts or Commanders are operating on the same network, all units will show this condition.
Port Numbers: Commander’s port numbers are expressed two ways. The physical ports are identified as Ports 00 through 10. The logical numbering system is Ports 1-11. Logical Port 11 is Commander’s internal CPU port. This port carries signals from the Ethernet switch to the internal processor. If communication is lost from this port, the switch will lose some functions that require the CPU, such as STP, RSTP and Multicasting. The CPU port is always connected to the same VLAN as logical Port 1.
Refresh Rate Commander’s status is viewed over the network on a client computer. Changes can only be viewed when the client’s web page is refreshed. This section allows the operator to select the refresh rate duration or no refresh at all. The Refresh status is reflected in the Status View’s header. Refresh Rate Enabled/Disabled This selection enables or disables the client’s status view refresh. Refresh must be enabled to avoid a 20 minute auto log and to see event warnings.
Front Panel Manual Auxiliary Operation Commander’s Auxiliary functions can be controlled from Status View by clicking on any of the auxiliary buttons. When an auxiliary button is selected, a pop up will appear asking the operator to confirm the selection. If OK is selected the auxiliary will become active. If Cancel is selected Commander will return to the previous screen. When OK is selected the auxiliary will become active and the auxiliary LED will change from grey to RED.
Activating an Auxiliary Commander allows an operator to manually activate an auxiliary. Move the mouse over an auxiliary in the off position. Left click will bring up an alert box asking to confirm your decision to active the auxiliary. OK will result in activation. Cancel will return the screen to the previous mode. Once an auxiliary is active it can be deactivated. Acknowledgement: In order for acknowledgement to respond to an alarm, it must be programmed as part of the security set up.
Tree View Tree View shows the status of sensors, alarm inputs and auxiliary outputs. These are referred to as “Logical Devices”. Tree View Operations When first clicking on the Tree View, the Device ID will appear. In the Tree, Commander is referred to as the ‘Physical Device” while the connections to Commander are referred to as “Logical Devices” If an operator has previously named Commander, that name will appear.
Aux (Auxiliary): The indicator to the left indicates the alarm status, Gray for OFF and Red when in the active alarm mode. The alarm mode will be display for its programmed duration or until the operator terminates by using the front panel status. The operator may provide a name for each. OFF indicates the alarm is not currently active. The first number indicates the number of times an OFF to ON state transition has occurred while the second indicates the number of times an ON to OFF has occurred.
Log Database Commander maintains a database of events.
Event & Polling Logs The Event log will display the time the Auxiliary was activated and the time the Auxiliary was de-activated which will be the time the operator selected this function. With regard to Sensor Alarm functions: (applies only to sensor events) The termination of the Auxiliary function will not affect the Alarm duration of a sensor event The alarm will remain active for the duration of that the alarm condition.
Deleting Event and Poll Logs Tree View provides three operations. They are: Save as: This will save the complete log. Email: This will email the complete log. Delete: This will delete any individual entry or the complete log. When the number of entries exceeds the screen view use the slider to view additional entries. Event and Polling Logs View The Event, Poll and Access Logs use two different methods for viewing all entries when they exceed a single page.
Saving Event and Polling Logs Clicking on the “Save As” button will open up a pop up asking to confirm your choice. Click OK to save or Cancel which will return the screen to the previous function. Requesting a Save As function will result either a request to save or open file depending on the type of browser used. Clicking the Email button will open up the Email address box. Fill in a primary email address and if required a CC or secondary address.
Email and Save As File Format When saved the format will display the log it was created from, the date and time. The last four digital represent the time expressed in military time. In the example below the Access Log was saved at 15:15 or 3:15 PM. AccessLog_28Nov06_1515.csv EventLog_28Nov06_1426.csv PollLog_28Nov06_1701.csv Commander provides individual email messages for all warning, alarm and log transmission functions.
Auxiliary Activation Emails Tue, 5 Jun 2007 12:26:27 -0400 commander Jeff 192.168.0.247 aux2_name OUT[2]OFF->ON. aux1_name OUT[1]OFF->ON. Internal Status Emails temp1=<1.00 -1.00 42.50> Current=42.500000 Threshold=>40.000000 Alarm temp3=<1.00 1.00 -127.50> Current=-127.500000 Threshold=<-16.000000 Alarm # in0: CPU I/O voltage (not scaled) # in1: CPU core voltage (not scaled) # in2: 3.3V nominal (not scaled) # in3: 5.
Log Filtering The filter function is divided into four major areas. They are: 1. Start Time and Date/End Time and Date 2. Probe 3. Contact 4. Auxiliary Port Filter functions are found under probes Time and Date: Click the Calendar next to the start date and select the starting date from the calendar. Enter the time and repeat the process for the End Time and Date. The time is entered as Hours: Minutes: Seconds.
Selecting Warning and Alarm Types Commander offers a choice of two different Warning and Alarm types. Each provides a drop down menu for selecting Temperature, Airflow or Humidity. If more than one Warning or Alarm Type is selected, the Filter function will “or” the selections. The conditions will define the probe.
No Search Results If the search yields no results and “No Records Found” pop will appear. Click OK to return to the previous screen and recheck the data you entered. Closing Filter: Close sorts by activating any other function. Important: Filter results will not be saved unless a “Save As” or “Email” action has taken place. Exiting to another function or starting another sort will automatically delete the sort results.
De-Selecting an Item to be Deleted To deselect an individual log entry, the entry must first have to have been selected and highlighted. Move the curser over the check box and left click. The highlight will return to a normal state.
Access Log Access Log is only accessible to Master Admin and IT Admin users. The access log displays the date/time, the name and access level of the person that signed on in addition to the Client IP address. The log also indicates if that person is current sign on or off. If the number of entries exceeds a single screen view, you either use the drop down box to move from page to page or the record advance arrows which will move the 100 records at a time.
If only a Start Date is provided: The search will display all results from that Start Date ending with the last record. If only an End Date is provided: The search will display all results ending with End Date. If both a Start Date and End Date are selected: The results will display all records between those dates. If only a Start Time is provided: The search will display all results from that Start Time ending with last record.
Email Event Log Email Log: Method of Operation Everyday is keyed off a 24 hour clock starting at midnight. Logs are sent on the hour depending on the duration programmed by the operator 1-hr: 00:00, 01:00, 02:00, 03:00 ...... 23:00 4-hr: 00:00, 04:00, 08:00, 12:00, 16:00, 20:00 6-hr: 00:00, 06:00, 12:00, 18:00 8-hr: 00:00, 08:00, 16:00 12-hr: 00:00, 12:00 24-hr: 00:00 Every month is keyed off a 24 hour clock starting at midnight on the first day of the month.
Probe Setup: P-TA/ P-TAH P-TA and P-TAH are intelligent probes. The parameters applied to a probe via operator programming will remain even if the probe is unplugged. If connected to another input ( in cases where a USB hub is used) on the same Commander or another input on a different Commander, upon power up the probe’s programming will automatically be read from Commander. Commander will automatically sense which type of probe is connected.
Probe Set up-Header Selected Probe: This is fixed and automatically downloaded from the probe when it is connected to Commander. A drop down box will list all the connected probes. The operator can select the probe to set up from the drop down listing. Updated by indicates who and when the last update to the probe was performed Polling every: This drop down box indicates if this probe will be included in the Polling Log and allows the operator to assign the duration between polling events.
Temperature Probe Alarm/ Warning Level Setup for Temperature, Airflow and Humidity Caution: Prior to setting any sensor levels it is important that sensors be placed in fixed operating physical positions. Changing the physical position of a sensor may require resetting the setup values. Commander provides individual warning and alarm levels for each sensor. Each of the three sensors can be custom programmed to meet any environmental condition. The following setups apply to Temperature, Airflow and Humidity.
Sensor Probe Setup: Programming the Auxiliary Duration Setting The Auxiliary Duration settings will only appear once a probe has been selected. The Duration provides a setting ranging from 0 Sec- Indefinitely 0 Sec = no auxiliary response occurs. 10 Seconds to 4 Hours = Auxiliary will remain active for the programmed duration. Follow = the auxiliary duration will follow the same duration of the active warning or alarm.
Setting Airflow Reference Setting the Airflow Reference: The primary function of airflow measurement is to determine if the fan is operational. The setting is relative and large changes in temperature could result in large changes to airflow values. To reduce the potential for false triggers the following settings are suggested: Reference=100%, Warning = 50%, Alarm = 25%. Unlike the current values that are applied to Humidity and Temperature, the Airflow setting is a relative value.
Humidity The probe’s internal humidity sensor reports values of relative humidity from 0 to 100%. The reported value is displayed on the Probe setup screen. Warning and alarm settings are the same as for temperature. Save Probe Settings/ Probe Restore Probe Set Up: Save To save the set up click the save button and the following screen will appear. Click OK to save settings.
Probe Setup P-VFP The power probe (model P-VFP) measures: Voltage, Frequency and Power. Setting Warning and Alarm Levels: Levels within the Lower and Upper range are normal. Levels outside this range will result in an alarm as programmed by the operator. Default Settings: Default settings are set at the factory and may have to be changed depending on the equipment operation and location. Settings for Log, Alert, Email, Aux Action and Durations are the same as for the P-TA and PTAH probes.
PortFlow™ PortFlow™ is a unique feature that allows an operator to determine signal quality at an individual port and set warning, alarm levels and port polling to in order assure data streams and signal quality are maintained. PortFlow is extremely important for monitoring video signals whose signal quality and reproduction rates must be constantly monitored and maintained to order to achieve satisfactory results.
PortFlow™: Setup: Selecting the Port to Program Selecting the Port by Name: If the port has been previous name it can be selected by the name drop down box. To Name a Port or Change a Port Name: Fill in a name to right hand side of the drop down box. Once the save function has been perform that name will appear in all logs and set up operations Polling Setting: The polling setting will determine how often the selected Port is polled.
PortFlow™: Setup: Warning and Alarm Setting the Email Address Input Email addresses that you want to receive warning and alert messages. You can enter as many email addresses as you want. Please make certain to separate each address with a space. Entering Port Warning and Alarm Levels This process starts by knowing what values to input. Commander reads and displays six previous port traffic readings each with 10 second duration. In total the previous 1 minute of activity is displayed.
PortFlow™: Setup: Saving and Confirming your settings Saving your settings: When Port Set up is complete, point and click on the Save button. A pop up will ask you to confirm your action. Click OK to complete Set up Confirmed: When the Set up is successfully completed the screen will indicate who performed the update by security level and the date and time. Setting Default: Click the Default button A pop up will ask you to confirm your decision. Click to OK. Commander will start a new count.
Alarm Setup This screen allows for hard contact Alarm inputs to be named and to set actions and durations. Email Address This will be the destination email address for all email messages regarding Alarm inputs 1 or 2. A standard Commander message is sent. See pg 106 for the format of email messages. Name This Name will appear in all logs and emails regarding the Alarm inputs 1 or 2. NC: The default condition is set for Normally Open (NO). A closed Alarm contact input will trigger alarms.
Auxiliary Assignment and Duration For each alarm input, the operator can assign two auxiliary outputs and corresponding durations. In the case where one contact output has been assigned to two different alarm inputs and the auxiliary output will respond to the first alarm occurrence. When that duration has ended, if the second alarm input is active, the auxiliary output will continue to be active.
Auxiliary Set Up This set up defines the action to be taken for each of the 2 auxiliary outputs when they are triggered per the previous alarm or sensor set ups. Email Address Enter an email address where an email alert will be sent. More than one email address can be entered. Make sure email addresses are separated by a space Auxiliary Name Enter a name for the auxiliary output. This is the name that will appear in the tree view and logs. Names can be up to 40 characters.
Communications Ports Commander provides two communication ports, one RS 232 and one RS 485. These can be operated as edge communication ports. The driver conforms to RFC2217 and can be operated by any communication program that is RFC 2217 complaint. AFI Pilot Software contains drivers for these ports and will automatically recognize them. RS communication ports can be used for data bi-directional communications for devices such as ATMS, PTZ and Cash Registers.
Confirm Setting changes Click Ok and a confirmation pop up box will appear. Click Ok and a confirmation that your settings have been saved will appear. Reset Communications In the event port communication is disrupted in any manner, the operator can restart communications by pressing the Reset button (RS 232 or RS 485).
Switch Setup Switch Flow Switch setup are restricted to Master Admin, IT Admin and IT Admin with Security View authorization settings. Further, Switch Setups can only be view by Master and IT authorization levels. Security levels cannot setup or access Switch Setups Warning: The following section contains network switch setups. Improper set up can degrade and/or significantly degrade switch performance. Please proceed only if you have knowledge in this area.
The screen reflects the port number and name assigned, Use the drop down boxes to Enable or Disable the port, set speed and duplex.
Disabling a Port: Using the drop down, select “Disable” for an individual port and click on Save. A pop up will appear asking you to confirm your choice. Selecting OK will bring up another pop up warning you that changes may result in you losing your network connection. Once a port is disabled its name convention will appear as RED and the port will disabled. Once the port is disabled, it can not be accessed and will not appear in certain set up modes.
Mac Filter Returning to Default: If mistakes are made during programming or there is need to return to default, press the Default button. MAC Filter: MAC Filter displays the MAC addresses available at each of the ports. The total devices connected to that port will be displayed along with their status as either Dynamic or Static. The MAC addresses of devices connected to a port will be shown in the list.
Spanning Tree Protocol STP / RSTP Setup In order to use STP or RSTP, the ports assigned for this purpose must be disabled in Switch Flow. These disabled ports will then be available in STP setup. Disabled port names will appear in Red. Both STP and RSTP use the same parameter settings. In almost all cases, the defaults settings should be used. Up to four Spanning Tree bridges may be maintained by Commander. Disabled ports are assigned to any one of the listed bridge numbers using the radio buttons provided.
Another warning dialog box will then appear. It is possible to apply settings that will make the Commander host CPU unreachable. Check your settings carefully before attempting to save the settings. Click OK to save. STP / RSTP Parameters Aging The aging time is the number of seconds a MAC address will be kept in the forwarding database after having received a packet from this MAC address. The entries in the forwarding database are periodically timed out to ensure they won't stay around forever.
VLAN Set Up Commander’s internal CPU is always on VLAN1. Port 01 is always active to insure a proper connection can be made to Commander in the default state. To Create a VLAN: Select the ports to assign to a VLAN. A port may be a member of only one VLAN. 10 VLAN IDs are available. Saving a VLAN will result in causing a dialog box to appear asking you to confirm your decision. Confirming your choice will remind you that you could lose your connection.
Disabled Ports: If a port has been disabled in the Switch Flow it will appear in RED. If a port has been selected for monitoring the port is also removed from further programming. The word “monitoring” will appear in the notes box. In both cases the port will removed from further programming and no set up screen will appear for that individual port(s).
Bandwidth Management Bandwidth Management Default Setting In the default setting, modes are set to “all” with no bandwidth limitations Mode Use the drop down box to select the type of mode the bandwidth setting will apply to. The choices are Flood, Broadcast and Multicast or Broadcast Ingress rate Limiting Select the bandwidth limitation rate from “Not Limited” to 8 Mb/s.
Non Accessible Ports: If a port has been assigned as monitoring or has been disabled it will not be able to be programmed for bandwidth limitations. Disabled ports will be displayed in RED. Ports assigned to monitoring will be indicated in the Notes section. Ports assigned to Trunking will be indicated in the notes section but can be programmed for bandwidth limitations Default: At any point in the programming point and click on Default will return the settings to their default settings.
QoS QoS has two different settings. Priority configuration is used to set port priority and Diff Serv is used assign transmit values. The default is set according to 802.1q IEEE standards. Default: At any point in the programming point and click on Default will return the settings to their default settings.
QoS Priority Settings Port Priority: To change port priority, use the drop down box. 10/100 base ports have 4 priority settings (0 to 3) and Gig A and B, 1000 base T ports have 8 priority settings (0 to 7). Lower values have a higher priority in the queue. QoS Diff Serv Settings Diff Serv Classes are shown in their 8 class settings by column. Use the drop down menu to change any of the settings.
Port Monitoring This program allows you to select a port for monitoring Ingress and Egress activity. Once a port is selected it is removed from the system and no programming activity is allowed. Selecting a Port: Use the drop down box to select a port: Important note: Once a port is selected for monitoring it cannot be selected for Ingress and Egress port and will NO LONGER be available for any other switch program function.
Selecting Ingress and Egress Ports Selecting Ingress and Egress Ports After the Monitoring port is programmed, select the Ingress and Egress ports to monitor. Important Note: Ingress and Egress ports cannot be the same as the selected monitor port. If this condition occurs a warning will be issued. Clicking on Save will issue a pop up asking you to confirm your selection. Selecting OK will issue a pop up warning that the action might result in a disconnect. Press OK to effect the change.
Port Trunking Port Trunking Default Screen Check a port to enable Port Trunking. To disable an active port, click on the checked box. Clicking on Save will issue a pop up asking you to confirm your selection Selecting OK will issue a pop up warning that the action might result in a disconnect.
Port Multicasting Commander Ethernet ports may be set for multicasting on a port by port basis. Individual ports may be set to IGMP Snooping, Disabled or Enabled. Commander will query via IGMP Snooping to keep multicasts alive. The Snooping query time may be set between 30 seconds and 10 minutes. Selecting the Disabled radio button will turn multicasting for the selected port off. Selecting the IGMP Snooping radio button will allow dynamic updates to the multicast groups.
Switch View (Statistics) Switch Statistics: This screen provides a view of all the activities for all active ports, including Port 11 which monitors Commander’s internal communications between ports and processor. The screen is refreshed very 10 seconds. Each port has a time stamp indicating the time of the last update for that port. This screen also provides the ability to email Port Statistics as a report by entering an email address and pressing Email.
Reboot Reboot Selection: It the event that Commander should stop operating or a new firmware update applied, it can be remotely rebooted. If a reboot become necessary, click on the “Reboot” button in the mode selection area. Warning: Rebooting will cause all event data to be lost. Make certain you back up your data on a regular basis. Reboot Confirmation: A pop up will appear asking you to confirm you decision. Click OK to confirm.
Q& A Commander is designed for trouble free and reliable operation. However if problems do develop please refer to this operations manual. If solutions are not provided using this method contact American Fibertek for assistance. Important Note: Commander maintains its memory by battery back up. However data files are not backed up. It is important that on regular bases you protect your data by either performing a Save As or Email Log function.
Problem: I was receiving email alerts from Commander and they suddenly stopped: Solution: If you are receiving email alerts using an internal network, check with your IT administrator to see if there were any network or firewall changes that could have affected your Commander settings.
Default Settings Commander is programmed with several default settings. The default settings are designed to help you limit your programming to only functions and features that are specific to your operation. Please note, Commander cannot be operated with only its in Default settings in place. Commander is designed to operate in the specific environment that you assign. It is strongly suggested that once you have completed your programming, you save you configuration.
Alarm Names: The default alarm name shall be labeled as alarm(#)-name. The alarm number sequence reflects the order of the alarms as they are physically positioned on Commander’s rear panel. Both alarms appear in the Tree View. Auxiliary Names: The default auxiliary name shall be labeled as the aux(#)_name. The auxiliary number sequence reflects the physical order of the auxiliary outputs as positioned on Commander’s rear panel. Both auxiliary names will appear in the Tree View.
Time and Date Setup: Date Format Enter date Time zone Time format Enter time mm/dd/yy (date will match date format) US Eastern 12 hours 12:01:00AM NTP Setup: Reference NTP Server Address none blank Update: Hours 0 Minutes 0 Firewall Setup: All settings will be blank Email Event Log: Time Email address Add email address 1 hour blank blank Probe Set Up: Select probe: User name Time Stamp Every Probe Type Front Panel Probe Name Email Warning and alarm levels Log, Alert, Email Aux Action 1 Duration Aux Ac
Alarm Set Up: Email Alarm name NC Log Alert Email Email Event log Aux Action 1 Duration Aux Action 2 Duration Blank Blank Off Off Off Off Off Auxiliary 1 0 Sec Auxiliary 1 0 Sec Auxiliary Setup: Email Address Name Log Alert Email Blank Blank Off Off Off RS 232 and RS 485 Communication: Speed: Bits Parity Stop bits Flow 115200 8 None 1 On Master Admin Operator Set Up: User Name Password Admin Password IT Admin Operator Set Up: User name Password ITAdmin Password Security Admin Operator Set Up: User
Email Messages Commander Email Messages: Commander provides several Email alerts which can be programmed by operators at various levels to send to Email accounts. The following is a listing of email messages: Hard Contact Alarm in Mon, 18 Sep 2006 21:30:23 +0700 (Date) (Time) (UTC offset) Commander-3 alarm3_name IN[3]OFF->ON. (Name) (Probe Name) (Status Change) Auxiliary Status Mon, 18 Sep 2006 10:35:12 -0400 (Date) (Time) (UTC offset) Commander 192.168.10.11 aux2_name OUT[2]ON->OFF.
NETMASK=255.255.255.0 NETWORK=192.168.10.0 BROADCAST=192.168.10.255 GATEWAY=192.168.10.126 DOMAIN='americanfibertek.local' DNS=192.168.10.126,192.168.10.122 DHCPSID=192.168.10.122 DHCPGIADDR=0.0.0.0 DHCPSIADDR=0.0.0.0 DHCPCHADDR=00:16:E2:FF:FF:F7 DHCPSHADDR=00:0C:41:F0:CC:FF DHCPSNAME='' LEASETIME=259200 RENEWALTIME=129600 REBINDTIME=226800 DHCP: New Address Email Commander can be operated in DHCP applications that require dynamic IP addressing.
Log File Formats Commander has many programming features that allow for sending alerts via FTP or Email and saving files. For automatic save, ftp server, and email log: ss1_access_log_Commander_One.csv ss1_event_log_Commander_One.csv ss1_poll_log_Commander_One.csv Note: *Commander One* is the device name. For manual save from within the web browser interface: AccessLog_28Nov06_1515.csv EventLog_28Nov06_1426.csv PollLog_28Nov06_1701.csv Note: last 4 digits are hour and minute.
Event & Polling Log Capacity Events are defined as warnings, alarm occurrences, hard contact alarms, and/or auxiliary triggers. Poll logs are programmed actions that occur based on an operator including a logical device (sensor, etc) in a poll and assigning a polling duration. The total capacity of all logs is 20,000 events. Sensor, Alarm, and Auxiliary Events each have a log capacity of 2,000 entries and will operate on the basis of First In, First Out.
Warranty and Contact Information American Fibertek provides several methods to help you with any technical problems. Our web site: www.americanfibertek.com provides help desk service. You can also call American Fibertek toll free 877-234-7200. Warranty American Fibertek, Inc warrants that at the time of delivery the products delivered will be free of defects in materials and workmanship for a period of 5 years. Defective products will be repaired or replaced at the exclusive option of American Fibertek.