Virtual Weather Station User's Guide Virtual Weather Station User's Manual For Davis Instruments Vantage Pro, Vantage Pro, Vantage Pro2, Vantage Pro2 Plus, Weather Monitor II, Weather Wizard III, Perception, Oregon Scientific WMR-918 (cable free), Oregon Scientific WMR-968 (cable free), Huger WMR-968H (cable free), Oregon Scientific WM -918, Huger WM -918H, Radio Shack WX-200, Radio Shack 63-1016 Wireless, Peet Bros Ultimeter 100/800/2000/2100, Rainwise WS-2000 and WT-2000 Weather Stations, Texas Weather I
Virtual Weather Station User's Guide Ambient, LLC License Agreement READ CAREFULLY BEFORE USING THIS SOFTWARE License Agreement. This software license agreement is a legal agreement between you (either an individual or entity) and Ambient, LLC. Copies and Adaptations. This software is copyrighted material. This license permits you to use one copy on a single computer. The license is not transferable. You may not rent, lease or loan the software.
Virtual Weather Station User's Guide Table of Contents 1 GENERAL DESCRIPTION ................................................................................................................................................. 9 2 VIRTUAL WEATHER STATION EDITIONS.................................................................................................................. 9 3 WEATHER STATION PART NUMBERS ...................................................................................................
Virtual Weather Station User's Guide 6.8 MULTIPLE STATION SETTINGS ............................................................................................................................................ 16 6.9 REAL -TIME DATA ............................................................................................................................................................... 16 6.10 WEATHER DISPLAYS.................................................................................................
Virtual Weather Station User's Guide 6.16.8 Rainfall Settings ..................................................................................................................................................... 28 6.16.9 Dominant Wind Direction Counter ........................................................................................................................ 29 6.16.10 Resetting Daily Minimum and Maximum Values ...................................................................................
Virtual Weather Station User's Guide 6.29.6 Reset ....................................................................................................................................................................... 41 6.29.6.1 Reset Total Rain .......................................................................................................................................... 41 6.29.6.2 Clear All Memory..................................................................................................
Virtual Weather Station User's Guide 8.8 VIRTUAL WEATHER STATION JPEG IMAGES ........................................................................................................................ 52 8.9 JPEG FILE INDEX................................................................................................................................................................. 52 8.10 OTHER JPEG FILENAMES......................................................................................................
Virtual Weather Station User's Guide 8.18.1.7.2.1 Longitude and Latitude .................................................................................................................. 82 8.18.1.7.2.2 Image Height and Width................................................................................................................ 82 8.18.1.7.2.3 Canvas Height and Width .............................................................................................................. 82 8.18.1.7.2.
Virtual Weather Station User's Guide 1 Manufacturer General Description Virtual Weather Station is a software package that allows you to connect your personal computer to your weather station to display, plot and store data for comprehensive monitoring and analysis. Virtual Weather Station brings your PC to life with a rich array of dynamic and colorful gauges, dials, graphs and charts.
Virtual Weather Station User's Guide Manufacturer Part Number Virtual Weather Station Reference 5.1 Installing the Software To install the software, run the following: ü Texas Weather Instruments 1-Wire Weather Stations Texas Weather Instruments Columbia Weather Systems Capricorn II, Capricorn 2000 Columbia Weather Systems WeatherHawk WeatherHawk WeatherHawk If transferring the files to your hard drive, copy all of the files to a common directory and run setup.exe . 5.2 5.2.
Virtual Weather Station User's Guide 6 6.1 Virtual Weather Station Base Edition Features Virtual Weather Station allows you to calibrate for improved accuracy. In addition, if your wind speed sensor is below the expected reading due to bearing life, or the anemometer is obstructed by trees, these errors can be adjusted to provide realistic values.
Virtual Weather Station User's Guide Figure 3 - Calibration 6.4 6.5.2 Communication Port Select the communication port. Refer to the chapter on Troubleshooting Tips for more information on selecting the correct communication port if you are unsure. Precision Menu Shortcut: Settings u Precision 6.5.3 Precision is the number of decimal places. For example a precision of two would be represented as 3.14, and a precision of three would be represented as 3.141.
Virtual Weather Station User's Guide will automatically close. another computer collected on the network. Virtual Weather Station will begin updating when all of the sensors have reported (can take up to one minute). Note that if a sensor is not reporting, it can be deactivated to continue running Virtual Weather Station. Reference Figure 7 – Stationless Mode Configuration. To operate in the Stationless mode, select the Stationless Weather Station option, and then the Stationless Settings button. 6.5.6.
Virtual Weather Station User's Guide 6.6.3 Hide Toolbar Select this option to hide the toolbar and status bar. This will increase the display viewing area. 6.6.4 Quit Program Prompt Prompts the user prior to terminating the program. 6.6.5 CPU Resources You can adjust the CPU resources VWS uses to run. The high setting will increase the performance of VWS but may decrease the performance of other programs.
Virtual Weather Station User's Guide sunset, moonrise and moonset. If you live in a time zone that does not adhere to the GMT standard and is offset by 30 minutes, enter the offset in the +Time Zone Offset (min) numerical field. ^wsdescription^ For more information regarding tags, please reference Section 8.13.1. 6.7.
Virtual Weather Station User's Guide Corrections Virtual Weather Station includes a celestial calendar for calculating sunrise, sunset, moonrise and moonset times. You can calculate these times for any calendar date. Figure 11 –Multiple Station Settings 6.9 Real-time Data Virtual Weather Station continuously collects data from your weather station. The sample rate varies based on your weather station's specifications. See your weather station user manual for specifics on the sample rate.
Virtual Weather Station User's Guide 6.10 Weather Displays Table 3 provides a list of the weather displays and a description of each display. Description 6.10.1 Display Icon Weather conditions based on weather station prediction. Switches from day to night based on sunrise and sunset times. 6.10.2 Broadcast TV broadcast display. Logo and location name can be modified by selecting right-mouse click on display. 6.10.3 Cable TV Slide Designed exclusively for WeatherCentral Cable TV applications.
Virtual Weather Station User's Guide Description 6.10.4 Display Cable TV Slide 2 Designed exclusively for WeatherCentral Cable TV applications. Allows user to incorporate into cable TV slide show. 6.10.5 Color Spectrum Color bars change color based on adjustable color spectrum. Displays daily high, low and current value. Rate of change arrow represents rising, falling or steady. 6.10.6 High / Low Display Simple daily high and low display. Displays daily high, low and current value.
Virtual Weather Station User's Guide Description 6.10.9 Display Thermometer Thermometer gauge with rate of change arrow and high / low pointers. 6.10.10 Gauge Rotary gauge with rate of change arrow. If the maximum limit of the gauge is exceeded, the gauge displays a red alarm box. 6.10.11 Meter Meter gauge with rate of change arrow. If the maximum limit of the gauge is exceeded, the gauge displays a red alarm box. 6.10.12 Graph, Graph2 Plot one or two parameters vs. time.
Virtual Weather Station User's Guide Description Display 6.10.13 Strip Chart Provides rapid real-time data (data is not stored). Intended for viewing data over minutes to view rapid trends (example, wind speed and wind direction). The strip chart does not store historical data, and will start over each time the program is launched. 6.10.14 Tank Colorful display fills based on color spectrum. Includes high and low pointers and rate of change arrow. 6.10.15 Alpha Numeric Simple alphanumeric display. 6.
Virtual Weather Station User's Guide 6.11 Customizing Displays 6.11.1 Attribute Adding and Deleting Displays Description Display Title Display Title can be modified for each display Display Title 2 Only valid for graphs and strip charts. Displays second graph title. Title Color Changes the title color. Title Color 2 Only valid for graphs and strip charts. Changes the title 2 color. Lower Limit Lower display numerical limit. Upper Limit Upper display numerical limit.
Virtual Weather Station User's Guide Attribute 6.11.3.3 Description Add second plot Adds a second plot to the graph or strip chart. Plot Color Specify plot color for both plots Grid Color Specify grid color Jpeg Filename Each graphical element has a specific jpeg filename when this option is activated. Provides a reference for each specific jpeg filename. For more information on jpeg files, reference Section 8.8.
Virtual Weather Station User's Guide 6.11.3.4.6 Reset Display at Midnight Display Setting Memory leaks may occur with some operating systems when updating images. To reset memory at midnight, select the checkbox and the panel will be discarded and reloaded. Description on the entire desktop and automatically scroll. Snap to Grid Pixels Specify the grid resolution for aligning the weather display images.
Virtual Weather Station User's Guide 10 minutes. Once the database reaches 20,000 records, is automatically resized to 15,000 records. A backup record of the database is stored in the following file: Column Number Parameter 19 Solar Radiation \VWS\data\yyyydbase.csv 20 Wind Chill where yyyy is the current year. 21 Indoor Heat Index If the database is damaged or deleted, simply rename the backup database.
Virtual Weather Station User's Guide Column Number Parameter 47 Solar Radiation Rate 48 Wind Chill Rate 49 Indoor Heat Index Rate 50 Outdoor Heat Index Rate 51 Dew Point Rate 52 Sea-level Barometric Pressure Rate 53 Rain Daily 54 Rain Hourly 55 Last 24 Hour Rain 56 Rain Rate (Oregon Scientific Only) 57 Wind Run Daily 58 Degree Days Heating Daily 59 Degree Days Cooling Daily 60 Moon phase 61 Monthly Rain 62 Degree Days Heating Monthly 63 Degree Days Cooling Monthly 64 Win
Virtual Weather Station User's Guide Channel Ch 1, 2, 3 Humidity Part No. Description Where to Buy Channel Ch 1, 2, 3 Temperature THC-268 Waterproof temperature probe for pools, spas, lakes, pipes, AC Ducts Link THGR-268 Indoor / Outdoor Thermo/Hygrometer Link Part No.
Virtual Weather Station User's Guide 6.15.3 Jpeg File Naming Convention 6.16.1.1 Heating Threshold To view the filename for the jpeg image, right-mouse-click on the weather display and the jpeg filename will be displayed. The threshold for calculating degree-days heating. For example, the jpeg filename for the Outdoor Temperature Spectrum is wc007.jpg The threshold for calculating degree-days cooling. 6.16.1.2 6.16.2 Cooling Threshold Wind Run Wind run is the distance wind has traveled.
Virtual Weather Station User's Guide season. The reason for the change was to improve upon the current WCT Index used by the NWS and the Meteorological Services of Canada (MSC, the Canadian equivalent of the NWS), which was based on the 1945 Siple and Passel Index. The new formula made use of advances in science, technology, and computer modeling to provide a more accurate, understandable, and useful for calculating the dangers from winter winds and freezing temperatures.
Virtual Weather Station User's Guide Figure 19 - Rainfall Settings 6.16.9 Dominant Wind Direction Counter Menu Shortcut: Settings u Dominant Wind Direction Virtual Weather Station calculates the dominant wind direction based on the day, month and year. The wind direction is only counted when the wind speed is greater than 0. The dominant wind direction values can be edited. This information is summarized in the NOAA reports. Figure 20 - Dominant Wind Direction Counter 6.16.
Virtual Weather Station User's Guide 6.17.1 Daily Highs and Lows No. Parameter Name Measured by Calculated Calculated Station by Station by VWS Daily highs and lows are calculated by Virtual Weather Station. Note that Virtual Weather Station must be running for the daily highs and lows to be recorded.
Virtual Weather Station User's Guide No. Parameter Name Measured by Calculated Calculated Station by Station by VWS No.
Virtual Weather Station User's Guide No. Parameter Name Measured by Calculated Calculated Station by Station by VWS Channel 3 Temperature Rate3 ü 43 Channel 3 Humidity Rate3 ü 44 Evapotranspirati on Rate4,5 ü 45 UV Index Rate4 or Battery Voltage Rate5 ü Solar Radiation Rate4,5 ü 47 Wind Chill Rate ü 48 Indoor Heat Index Rate 49 No. Parameter Name Measured by Calculated Calculated Station by Station by VWS 60 Total Rain Avg. ü 61 Channel 1 Temperature Avg.
Virtual Weather Station User's Guide No. Parameter Name Measured by Calculated Calculated Station by Station by VWS Indoor Humidity Daily High ü Outdoor Humidity Daily High ü Indoor Temperature Daily High ü 81 Outdoor Temperature Daily High ü 82 Barometric Pressure Daily High ü Total Rain Daily High ü Channel 1 Temperature High 3 ü Channel 1 Humidity High 3 ü Channel 2 Temperature High 3 ü 87 Channel 2 Humidity High 3 ü 88 Channel 3 Temperature High 3 89 78 No.
Virtual Weather Station User's Guide No. Parameter Name Measured by Calculated Calculated Station by Station by VWS No.
Virtual Weather Station User's Guide Table 11 - Complete Parameter List No.
Virtual Weather Station User's Guide the text field (with the exception of the predominant wind direction). 6.21.1 Display Attributes The icon displays the current temperature. The color, units and precision of the displayed temperature can be changed. The icon frame width and color can also be modified. The display includes the number of samples for the year. This panel is updated hourly. 6.21.
Virtual Weather Station User's Guide You can create your own icons to replace the icons provided with the distribution kit. Make sure you save these icons as “read only” to prevent Virtual Weather Station from overwriting at the next installation of Virtual Weather Station. 6.22.2 Boolean Settings Boolean settings allow you to set conditions based on multiple parameters defined in the Smart Forecast section. Note that the Smart Forecast parameters need not be active to be used in the Boolean Settings.
Virtual Weather Station User's Guide sound when the rain rate is exceeded, or a bird chirp when the temperature is high enough to open windows in the house. In addition, you can run an executable or batch file when a condition is exceeded. 6.23.1 .exe, .com, and .bat DOS programs use the settings in default.pif (in your Windows directory) when running. You can change their priority, display options, etc., by editing default.pif or by creating another pif file.
Virtual Weather Station User's Guide Outdoor Temperature Outdoor Humidity Wind Direction @ Wind Speed 6.26 Rainwise Settings The Rainwise Weather Station includes a programmable data logger. Reference Figure 27 - Rainwise Settings. The following settings can be adjusted. 6.26.1 Sea-level Barometer Adjustment (418 MHz systems only) DD is day ü hh is hour (24 hour time) ü mm is minute ü ss is second 1, 2, 5, 10, 15, 20, 30, or 60 minutes 6.26.
Virtual Weather Station User's Guide 6.28 Vantage Pro / Weather Link Settings 6.28.1 Vantage Pro Settings Menu Shortcut: Settings u Vantage / WeatherLink Settings The Davis weather station console can be programmed for calibration offsets, barometric pressure sea-level correction, and setting date and time. Figure 30 – Vantage / WeatherLink Alarms 6.29 WeatherHawk Settings Menu Shortcut: Settings u WeatherHawk Settings 6.29.
Virtual Weather Station User's Guide 6.29.5.3 Cancel Download Data To determine these values: select the barometer display on your weather station monitor and toggle between REF and ABS and enter the values into Virtual Weather Station. Cancels the current download 6.29.5.4 Last Download Record Provides a marker for the last record downloaded from archive memory. The next time Virtual Weather Station is launched, the next record will be downloaded. 6.29.6 Reset 6.29.6.
Virtual Weather Station User's Guide continue the WeatherLink database. Combine with a third party PC Auto Call Center to provide a complete PC-based phone answering system. Keep up to date on your local weather, advertise your service, and stay connected to the weather! Enter Your Station Directory, the location of the WeatherLink executable file, and select if you want to automatically generate NOAA monthly and yearly summary reports within WeatherLink. 6.33.
Virtual Weather Station User's Guide stored in the following location: 7 \VWS\data\daily\yyyymmdd.txt Virtual Weather Station Pro Edition 7.1 where yyyy is the year, mm is the month and dd is the day. For example, data stored on May 9, 2000 is designated by the filename: File Settings (Data Logging) Menu Shortcut: Settings u File Settings \VWS\data\20000509.txt Virtual Weather Station includes a data logger, which provides a permanent record of your weather data.
Virtual Weather Station User's Guide Wind Chill 76.3 In Heat Ix 74.7 Out Heat Ix 75.7 Dew Point 46.7 SL Barometer 29.03 2:18pm 4:46pm 2:18pm 4:11pm 2:18pm 60.0 65.2 66.2 39.0 29.00 3:09pm 3:09pm 3:09pm 3:09pm 4:49pm 63.4 69.2 69.1 40.2 29.01 Figure 37 – Archived Data Text File 7.1.4.1 ü Daily Archive Files The daily archive files are stored in the following location: ü \VWS\data\archive\daily\dailyarc.txt \VWS\data\archive\20000509.txt The date stamped format is the same as the daily.txt format.
Virtual Weather Station User's Guide 7.1.6 Summary Files The file is stored in the following location: This file provides a summary of the average, high and low values for each parameter specified in the File Parameter List (reference Section 7.1.8). Date ü \vws\data\summary\daysum.txt An example is shown in Figure 38 – Example Daily Summary File.
Virtual Weather Station User's Guide Column Identifier Prototype Column Identifier Prototype (°F) 15 Barometer (in) Floating Point 15 Barometer (in) Floating Point 16 Total Rain (in) Floating Point 16 Total Rain (in) Floating Point 17 Daily Rain (in) Floating Point 17 Daily Rain (in) Floating Point 18 Hourly Rain (in) Floating Point 18 Hourly Rain (in) Floating Point 19 Weather Condition, where: Integer 19 Weather Condition, where: Integer 0 = clear 1 = few clouds 2 = sca
Virtual Weather Station User's Guide Column Identifier 7.3 Prototype There are two types of climate reports - monthly and yearly.
Virtual Weather Station User's Guide 7.4.1 Modifying the Monthly Climate Report is displayed. Menu Shortcut: Settings u Monthly Archive 7.5.1 Modifying the Yearly Climate Report To modify the monthly climate report, enter the month and year, and modify the stored values. Menu Shortcut: Settings u Yearly Archive 7.5 To modify the yearly climate report, enter the year, and modify the stored values. Yearly Climate Report Menu Shortcut: Reports u Yearly Report 7.
Virtual Weather Station User's Guide 8 Virtual Weather Station Internet Edition The software automatically converts display panels into jpeg images that any client using a World Wide Web (WWW or Web) browser can access. The software is compatible with standard Web browsers and requires no additional networking software or configuration. Virtual Weather Station Internet Edition features Email, FTP File Transfer, and HTTP file transfer.
Virtual Weather Station User's Guide Figure 42 – Webpage example created with the Virtual Weather Station Weather Website Builder. jpeg files to another location on the network without using ftp or web server options. 8.2 The following sections outline settings for your specific application. Internet Features and Operation The following section describes methods for displaying your weather data on the Internet or Intranet. 8.
Virtual Weather Station User's Guide 8.6.3 8.4 Connecting to the Internet Use the Following Dial-up Networking Connection Select one of the dial-up networking connections defined in the Windows Dial-up Networking. Most Internet service providers provide the following features: A direct connection to the Internet 8.6.4 A remote World Wide Web Server Username, Password and Domain Dial-up networking account information. A remote Ftp Server 8.6.
Virtual Weather Station User's Guide 8.7 General FTP Settings The following general FTP Settings allow you to control each FTP session. 8.7.1 FTP Timeout The timeout period for each FTP operation. 8.7.2 Successive Login Attempts Number of successive attempts to login to the FTP server. 8.7.3 Maximum Connect Time The maximum time period to remain connected to the server. This prevents extended connections due to slow internet connections or failed connections. 8.7.
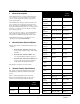
Virtual Weather Station User's Guide Graph2 Tank Meter Strip Chart Distribution Moon Phase Alpha Numeric Graph Gauge Thermometer Wind Direction High/Low Color Spectrum Parameter / Display Wind Direction 001 148 295 442 589 736 883 --- 1177 1324 1471 1618 1765 Wind Speed 002 149 --- 443 590 737 884 --- 1178 1325 1472 1619 1766 Gust 003 150 --- 444 591 738 885 --- 1179 1326 1473 1620 1767 Indoor Humidity 004 151 --- 445 592 739 886 --- 1180 1327 1474 1621 1768 Outdoor
Virtual Weather Station User's Guide Graph2 Tank Meter Strip Chart Distribution Moon Phase Alpha Numeric Graph Gauge Thermometer Wind Direction High/Low Color Spectrum Parameter / Display Wind Chill 019 166 --- 460 607 754 901 --- 1195 1342 1489 1636 1783 Heat Index In 020 167 --- 461 608 755 902 --- 1196 1343 1490 1637 1784 Heat Index Out 021 168 --- 462 609 756 903 --- 1197 1344 1491 1638 1785 Dewpoint 022 169 --- 463 610 757 904 --- 1198 1345 1492 1639 1786 Sea-l
Virtual Weather Station User's Guide Graph2 Tank Meter Strip Chart Distribution Moon Phase Alpha Numeric Graph Gauge Thermometer Wind Direction High/Low Color Spectrum Parameter / Display 968/WMR-918, Davis Vantage Pro) Channel 3 Temperature Rate (WMR-968/WMR-918, Davis Vantage Pro) 042 189 --- 483 630 777 924 --- 1218 1365 1512 1659 1806 Channel 3 Humidity Rate (WMR- 043 968/WMR-918, Davis Vantage Pro) 190 --- 484 631 778 925 --- 1219 1366 1513 1660 1807 Evapotranspiration Rate (
Virtual Weather Station User's Guide Graph2 Tank Meter Strip Chart Distribution Moon Phase Alpha Numeric Graph Gauge Thermometer Wind Direction High/Low Color Spectrum Parameter / Display Vantage Pro) Channel 1 Humidity Average (WMR-968/WMR-918, Davis Vantage Pro) 063 209 --- 503 650 797 944 --- 1238 1385 1532 1679 1826 Channel 2 Temperature Average 063 (WMR-968/WMR-91, Davis Vantage Pro 8) 210 --- 504 651 798 945 --- 1239 1386 1533 1680 1827 Channel 2 Humidity Average (WMR-968/WM
Virtual Weather Station User's Guide Graph2 Tank Meter Strip Chart Distribution Moon Phase Alpha Numeric Graph Gauge Thermometer Wind Direction High/Low Color Spectrum Parameter / Display Indoor Temperature High --- --- --- --- --- --- --- --- --- --- --- --- --- Outdoor Temperature High --- --- --- --- --- --- --- --- --- --- --- --- --- Barometer High --- --- --- --- --- --- --- --- --- --- --- --- --- Total Rain High --- --- --- --- --- --- -
Virtual Weather Station User's Guide Graph2 Tank Meter Strip Chart Distribution Moon Phase Alpha Numeric Graph Gauge Thermometer Wind Direction High/Low Color Spectrum Parameter / Display Wind Direction Low --- --- --- --- --- --- 980 --- --- --- --- --- --- Wind Speed Low --- --- --- --- --- --- 981 --- --- --- --- --- --- Gust Low --- --- --- --- --- --- 982 --- --- --- --- --- --- Indoor Humidity Low --- --- --- --- --- --- 983 --- --- --- --
Virtual Weather Station User's Guide Graph2 Tank Meter Strip Chart Distribution Moon Phase Alpha Numeric Graph Gauge Thermometer Wind Direction High/Low Color Spectrum Parameter / Display Wind Chill Low --- --- --- --- --- --- 998 --- --- --- --- --- --- Heat Index In Low --- --- --- --- --- --- 999 --- --- --- --- --- --- Heat Index Out Low --- --- --- --- --- --- 1000 --- --- --- --- --- --- Dewpoint Low --- --- --- --- --- --- 1001 --- --- ---
Virtual Weather Station User's Guide Graph2 Tank Meter Strip Chart Distribution Moon Phase Alpha Numeric Graph Gauge Thermometer Wind Direction High/Low Color Spectrum Parameter / Display Date --- --- --- --- --- --- 1024 --- --- --- --- --- --- Time --- --- --- --- --- --- 1025 --- --- --- --- --- --- Sunrise --- --- --- --- --- --- 1026 --- --- --- --- --- --- Sunset --- --- --- --- --- --- 1027 --- --- --- --- --- --- Moonrise --- --- -
Virtual Weather Station User's Guide To create a template file, save the template with an htx file extension with any text editor or web authoring tool. 8.13.3 Complete List of Tags Menu Shortcut: Internet u HTML Tags To view the complete list of tags, select the Complete Tag List icon located in this window. 8.13.4 Inserting HTML Tags Into the Templates There are three types of File Tags: Each weather parameter has a unique file tag.
Virtual Weather Station User's Guide Tag Name Description Tag Name ^vmh###^ vmh = Virtual Weather Monthly High ^vmd###^ vmd = Virtual Weather Monthly High Date ^vml###^ vml = Virtual Weather Monthly Low ^vme###^ vme = Virtual Weather Monthly Low Date ^vyh###^ vyh = Virtual Weather Yearly High ^vyd###^ vyd = Virtual Weather Yearly High Date ^vyl###^ vyl = Virtual Weather Yearly Low ^vye###^ vye = Virtual Weather Yearly Low Date ^vzh###^ vzh = Virtual Weather Yesterday’s High ^vzt###^ vz
Virtual Weather Station User's Guide Tag Name Description Tag Name Description ^mtr005ABCD^ ABCD = METAR identifier, 005 specifies the METAR Dew Point. Temperature. Example: ^mtrKLAX005^ ^mtr005ABCD^ ABCD = METAR identifier, 005 specifies the METAR Dew Point. Example: ^mtrKLAX005^ ^mtr006ABCD^ Example: ^mtrKLAX005^ ABCD = METAR identifier, 006 specifies the METAR % Relative Humidity.
Virtual Weather Station User's Guide Tag Name Description Tag Name Description Example: ^mtrKLAX014^ ^mtr015ABCD^ ABCD = METAR identifier, 015 specifies the METAR Rain/hr. ^mtr015ABCD^ Example: ^mtrKLAX015^ ^mtr016ABCD^ Example: ^mtrKLAX015^ ABCD = METAR identifier, 016 specifies the METAR Wind Chill. ^mtr016ABCD^ Example: ^mtrKLAX016^ ^mtr017ABCD^ ABCD = METAR identifier, 015 specifies the METAR Rain/hr. ABCD = METAR identifier, 016 specifies the METAR Wind Chill.
Virtual Weather Station User's Guide Tag Name Description Tag Name Description # = location (1 to 15) ^almmtd#^ almmtd - Almanac normal month-todate precipitation ^almmtd#^ # = location (1 to 15) ^climate_cconds #^ # = location (1 to 15) ^climate_cconds #^ climate_cconds - Current weather conditions # = location (1 to 15) ^climate_icon#^ ^climate_city#^ climate_cconds - Current weather conditions # = location (1 to 15) climate_icon – Current weather conditions ^climate_icon#^ climate_icon –
Virtual Weather Station User's Guide Tag Name Description Tag Name Description # = station number (1 to 30) meso_loc# meso_loc – Mesonet Station ID meso_loc# # = station number (1 to 30) meso_neigh# # = station number (1 to 30) meso_neigh – Mesonet Neighborhood meso_neigh# # = station number (1 to 30) meso_url# meso_url – Mesonet URL link to weather website meso_url# meso_URLtext – Mesonet URL link text to weather website meso_URLtext# meso_historyURL – Mesonet URL to history data on Weather
Virtual Weather Station User's Guide Tag Name Description Tag Name Description # = station number (1 to 30) meso_barom# meso_loc – Mesonet Station ID meso_barom# # = station number (1 to 30) meso_rrate# meso_loc – Mesonet Station ID # = station number (1 to 30) meso_loc – Mesonet Station ID meso_rrate# # = station number (1 to 30) meso_loc – Mesonet Station ID # = station number (1 to 30) MISC. DATA MISC.
Virtual Weather Station User's Guide Tag Name Description Tag Name Description pa = Pacific Ocean, USA, Mexico and Central America at = Atlantic Ocean, USA, Central America us = USA Lower 48 nw = Northwest USA sw = Southwest USA mw = Midwest USA sp = Southcentral USA ne = Northeast USA se = Southeast USA ak = Alaska hi = Hawaii pr = Puerto Rico cn = Canada ca = Mexico and Central America sa = South America gl = Greenland eu = Europe as = Asia a2 = Southeast Asia af = Africa au = Australia and New Zealan
Virtual Weather Station User's Guide Tag Name Description Tag Name Description forecast_country # 5-Day Forecast country ID for use with Wunderground graphics. # = station number (1 to 4) forecast_country # 5-Day Forecast country ID for use with Wunderground graphics. # = station number (1 to 4) forecast_radregi on# # = station number (1 to 4) 5-Day Forecast radar region ID for use with Wunderground radar regional graphics.
Virtual Weather Station User's Guide Tag Name Description Tag Name Description Mostly Cloudy Mostly Sunny Partly Cloudy Partly Sunny Rain Sleat Snow Sunny Thunderstorms Unknown forecast_iconx_# temp_for_hix_# temp_for_lox_ forecast_icon – 5-Day forecast icon name forecast_iconx_# forecast_icon – 5-Day forecast icon name chancetstorms = Chance Thunder storms chanceflurries = Chance Flurries chancerain = Chance Rain chancesleat = Chance Sleat clear = Clear cloudy = Cloudy fog = Fog flurries = Flurri
Virtual Weather Station User's Guide Tag Name Description background color, based on Figure 47 Color spectrum for the HTML Tags. Example HTML usage: ü Update HTML Timer. Specifies how often to update the HTML panels. ü On. Activates the parsing and saving of the html file ü Template File. HTML template file (htx) contains the HTML tags ü HTML Filename . File created by the template file. ü Browse. Browse to the location of the file(s) ü Preview. Previews the Web Page in your default browser.
Virtual Weather Station User's Guide computer. 8.15.1 Connecting to Your Remote Ftp Server Verify you can connect to your Ftp Server. Select [Internet][Login] from the menubar. Menu Shortcut: Internet u FTP Login Figure 49 - Creating Web Pages with Virtual Weather Station Tags 8.14 HTML File Tags File tags can be inserted into the HTML template (htx) to display data from a text file directly in your web page.
Virtual Weather Station User's Guide 8.15.2.1 Sending Jpeg Files Displayed in Virtual Weather Station Desktop to the Internet (Jpeg FTP Settings) For each element on your desktop, a jpeg image is generated. The files are sent to the created and sent to the Internet at the same time based on a schedule. Reference Figure 52 - Jpeg FTP Settings. The following sections describe the jpeg FTP settings. 8.15.2.1.
Virtual Weather Station User's Guide server). addressable from the Internet, and must be in text format only. Menu Shortcut: Internet u FTP Upload File (Send) The files are saved on your local drive and can be used for display in your web pages using file tags (see the section on File Tags for more details). FTP (ftp://) or HTTP (http://) files can be downloaded. For more information on obtaining National Weather Service text data, please visit http://weather.noaa.
Virtual Weather Station User's Guide messages and attachments when alarm limits are exceeded. You can also send periodic weather reports. To view the E Mail settings, select [Settings][Email] from the menubar. The weather report data is appended to the Email message specified in the Email panel. Enter the following information: 8.16.3 Email alarms can be sent based on alarm conditions. See Alarms for more information. To view the alarms panel, select the Alarm icon from the display panel.
Virtual Weather Station User's Guide and as inputs to global weather models for both analysis and forecasting. It is this global use of each small bit of information which drives the need for standardization. Additionally, the increase in international flights between the U.S. and other nations from more U.S. locations than ever before lends itself to developing a more "seamless" international standard for aviation.
Virtual Weather Station User's Guide Figure 59 – METAR Icon Display Settings 8.17.6 METAR Settings Figure 60 – METAR Icon Settings Menu Shortcut: Modify Display u METAR Icons To define METAR settings, select [Modify Display][METAR Icons] from the Menubar. 8.17.7 METAR Report Generator Menu Shortcut: METAR u METAR Generator The following METAR settings are adjustable. Parameter Since METAR is the reporting standard for weather observations, VWS generates METAR reports so you can share weather data.
Virtual Weather Station User's Guide 8.17.8.1 METAR Summary Text Report following file location: The METAR summary text reports are located in the Location Last Update Date and Time Van Nuys 05/29/2001 09:51pm Burbank 05/29/2001 08:53pm Los Angeles 05/29/2001 09:50pm ü Temp Dew HtIx Chill %Rh °F °F °F °F 66 68 63 61 55 59 71 70 68 66 63 60 \data\metar.txt Press Rain Wind Wind % in in Dir Spd 83 64 88 29.91 29.90 29.
Virtual Weather Station User's Guide by registering your weather station or select the following link: following: Warning Priority http://www.wunderground.com/weatherstation/index.asp Special Weather Statement 1 After registering, your information will be displayed on the Weather Underground site real-time. This allows anyone in the world to view your data, including up to the minute reports, daily highs and lows, graphical, and text data. Winter Weather Statement 1 Local Storm Report 1 8.18.1.
Virtual Weather Station User's Guide Text reports are generated for each location (numbered 1 through 15) in the following location: \vws\data\warnings\#.txt where # is the location number. Figure 67 - Climate Reports 8.18.1.5 Five Day Forecast Menu Shortcut: Wunderground u 5-Day Forecast Figure 66 –Weather Warnings 8.18.1.4 Virtual Weather Station will download the 5-Day forecast data from the National Weather Service for any location around the world.
Virtual Weather Station User's Guide Figure 68 – Five Day Forecast 8.18.1.6 Mesonet Mesonet is a combination of the words "mesoscale" and "network". In meteorology, "mesoscale" refers to weather events that range in size from a few miles to a few hundred miles. Mesoscale events last from several minutes to several hours. Thunderstorms and squall lines are two examples of mesoscale events. A "network" is an interconnected system.
Virtual Weather Station User's Guide To create a map background, you must determine the longitude and latitude of all four corners of the map. Virtual Weather Station will automatically place the weather stations in the proper location. Note that longitude values are negative for the United States. A common mistake is to enter a larger value (less negative) on the left hand side of the map then the left hand side of the map. 8.18.1.7.2.
Virtual Weather Station User's Guide minutes) 8.18.1.7.3.4.1 Title and Date Stamp This feature adds a title and a time and date stamp to the upper left hand corner of the image. You can delete stations that have expired based on a defined time frame. For example, if the reported data is over one hour old, you may want to remove it from the map display. 8.18.1.7.4 Background Map You can insert a static or dynamic background map into the display.
Virtual Weather Station User's Guide any timeout problems with Internet functions. For more information, contact support@AmbientWeather.com. Figure 75 – Internet Status Messages and Error Log Figure 74 – APRS Settings 8.19 Internet Status and Log 9 Virtual Weather Station Add-ons Menu Shortcut: Help u Internet Status and Log 9.1 8.19.1 Turning Off the Internet Functions To turn off all internet functions, select the Turn Off All Internet Features switch. 8.19.
Virtual Weather Station User's Guide ü Control sprinkler systems after a rain. ü Control your irrigation system ü Monitor and control your pool, spa or air conditioning systems. ü Monitor your home automation and environmental conditions from anywhere in the world over the Internet. 9.1.2 X10 Controls Virtual Weather Station communicates to HomeSeer (www.homeseer.com) home automation software to provide a complete environmental control and monitoring system using X10 Control Technology.
Virtual Weather Station User's Guide http://www.ambientweather.com/ExtDesc.asp?id=113 ü Use spoken audio files as background sounds on your website 9.2 ü Combine with a third party PC Auto Call Center to provide a complete PC-based phone answering system.
Virtual Weather Station User's Guide Table 17 – Text to Wav File Conversion takes tag information and converts it to text files. For more information on obtaining National Weather Service text data, please visit http://weather.noaa.gov/pub/data 9.2.3 Temporary Files (\vws\voices\wav\*.wav) TTS Voices and Microsoft’s TTS Center For more information on Tags, please reference Section 8.13.1. The Microsoft Text -to-Speech engine was included with your WeatherVoice distribution kit.
Virtual Weather Station User's Guide 9.2.4.9 Sample Rate The sample rate of the converted speech (wav) file. The output sampling rate is based on your modem or application. Most modem output frequency is 8,000 Hz. Most computer applications are recommended at 16,000 Hz.
Virtual Weather Station User's Guide 9.3 WeatherFlash (Internet Version of Virtual Weather Station Required) WeatherFlash is the first Web-based, real-time, comprehensive monitoring and analysis interface that is completely controlled by you! You pick the display options, you pick the colors, you design the layout, you select the update interval. With Ambient's WeatherFlash, you are in control.
Virtual Weather Station User's Guide http://www.AmbientWeather.com/WxFlash/ 9.4 Image Salsa ImageSalsa captures images from your webcam and creates a series of jpeg images for web page insertion, real-time streaming video, graphical and text overlays, and integrates with Virtual Weather Station to create real-time weather displays. Imagine watching the clouds roll in and out using the time lapse photography feature, and then overlaying weather data to monitor the changing weather conditions.
Virtual Weather Station User's Guide Problem Solution Your serial port is defective Your weather station serial port is defective. Unplug the station's AC adapter from the utility and run the station on battery power. If the LEDs display communication, reconnect the station's AC adapter. If the unit stops communicating again, contact Oregon Scientific. See Advanced Communication Troubleshooting Tips Communication only occurs while on the batteries and not the AC.
Virtual Weather Station User's Guide Problem Solution The celestial calculator is a close approximation of the sunrise and sunset in your location and may be inaccurate by several minutes due to equation inaccuracy or your altitude (the equations are based on sea-level). You can account for this inaccuracy by entering a number in the offset (-60 minutes to +60 minutes). Sunrise and sunset are off by one hour, or did not change with the Daylight Savings Time Change.
Virtual Weather Station User's Guide Problem Solution cause long delays. The font size is incorrect after changing the font type Changing font type can also change the font size due to font size limitations. To restore default fonts, select the Default button from the font settings window and restart the program. The Moonrise (or Moonset) is showing -- instead of the time Approximately once a month, the moon does not rise (or set) on a given day.
Virtual Weather Station User's Guide Problem Solution The Daily Rain is not correct The program must be running at midnight for today's daily rainfall to be correct. The Weather Station does not store daily rainfall. The monthly rainfall reported in the NOAA report does not agree with the sum of the daily rainfall. This is due to the station total rainfall reset by the user, or the values for minimum or maximum rain edited by the user. Reference 6.19.2 for more details to correct this.
Virtual Weather Station User's Guide Problem Solution If your computer is running other utilities, the clock speed may be affected even more. Your computer may need a tune-up. Here are some useful hints: 1) Don't run continuous virus checking. Have virus scanner scan your files on a batch basis. Continuous virus checking slows down your computer. 2) We have had excellent luck with two parts of Norton Utilities: (a) Norton Optimization Wizard (gets your swap file to the right size) (b) WinDoctor.
Virtual Weather Station User's Guide Problem Solution 4.00.950 Install Service Pack 1 first, then install the Kernel 32 Update. 4.00.950a Install the Kernel 32 Update. 4.00.950B Service Pack 1 and Kernel Update not needed. 4.00.950C Service Pack 1 and Kernel Update not needed. NOTE: The kernel update should only be applied if you have already installed Service Pack 1 for Windows 95. If you have Windows 95 version 4.00.
Virtual Weather Station User's Guide Problem System Socket Web Server Error Solution Check to make sure you are connected to the Internet, or you are not conflicting with another Web Server running on your PC. Quit the Virtual Weather Station program and manually connect to the World Wide Web. Relaunch Virtual Weather Station. • Another application is dialing and taking over the modem when VWS dials.
Virtual Weather Station User's Guide 10.1 Advanced Communication Troubleshooting Tips for Oregon Scientific Weather Stations If you followed the troubleshooting tips above and could not find a solution, you likely have a problem with your station's communication port, the cable or your computer. To verify that you are receiving data, launch Hyper Terminal, which is a terminal emulation program distributed with most Windows operating systems.
Virtual Weather Station User's Guide Term Definition GUST A sudden significant increase in or rapid fluctuations of wind speed. Peak wind must reach at least 16 knots (18 miles per hour) and the variation between peaks and lulls is at least 10 knots (11.5 miles per hour). The duration is usually less twenty seconds. HEAT INDEX The combination of air temperature and humidity that gives a description of how the temperature feels. This is not the actual air temperature.
Virtual Weather Station User's Guide Term Definition sun just disappears below the sea level horizon. In Great Britain, the center of the sun's disk is used instead. Time of sunset is calculated for mean sea level. See sunrise for comparison. VAPOR PRESSURE The pressure exerted by water vapor molecules in a given volume of air VIRTUAL TEMPERATURE Virtual temperature is a fictitious temperature that takes into account moisture in the air.
Virtual Weather Station User's Guide Air speed Number and description Features kph mph 9 strong gale branches break from trees 75–87 47–54 10 storm trees uprooted; weak buildings collapse 88–101 55–63 11 violent storm widespread damage 102–117 64–73 12 hurricane widespread structural damage above 118 above 74 Table 20 - Beaufort Scale 11.2 Scale Heat Stress Index The Heat Stress Index calculates the body's reaction to heat and humidity, or the Heat Index.