
User's Manual

Chapter 3 - Operation and Administration Using the CLI Monitoring Performance of Hardware and Software
4Motion 664 System Manual
3.10.4 Displaying System Files
The following system files reside in the TFTP boot directory of the NPU:
Performance data files: Contain performance counters for system modules.
(For more information about the modules for which you can configure
collection and storage of performance data, refer Section 3.3.13. These files
are available in the path, /tftpboot/management/performance.
System log: Contain log and trace messages. (For more information about
configuring logging and tracing, refer Section 3.11.1 and Section 3.3.12. These
files are available in the path, /tftpboot/management/system_logs/.
Active alarms: Contain a list of currently active alarms. These files are residing
in the path, /tftpboot/management/fault.
User history files: Contain information about the commands/tasks executed
by the user. These files are available in the path,
/tftpboot/management/user_log.
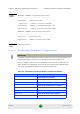
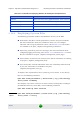
To display a list of performance data, system log, active alarms, or user history
files, run the following command:
npu# show saved {Performance | Active-alarm | Log | User-history}
files [recent <1-65535>]
For example, if you want to view the 30 most recently saved log files, residing in
the TFTP boot directory of the NPU, run the following command:
npu# show saved Log files recent 30
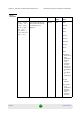
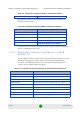
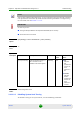
Data Port npu# show interface gigabitethernet 0/10 counters
Internal Management Interface
npu# show interface internal-mgmt counters
External Management Interface
npu# show interface external-mgmt counters
Bearer Interface npu# show interface bearer counters
Local Management Interface npu# show interface local-mgmt counters
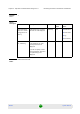
Command
Syntax
npu# show saved {Performance | Active-alarm | Log | User-history}
files [recent <1-65535>]
Table 3-37: Commands for Displaying Statistics for All Physical and IP Interfaces
Example