MaxInsight™ Manual MAX Communication Server Release 7.
WARNING! Toll fraud is committed when individuals unlawfully gain access to customer telecommunication systems. This is a criminal offense. Currently, we do not know of any telecommunications system that is immune to this type of criminal activity. AltiGen Communications, Inc., will not accept liability for any damages, including long distance charges, which result from unauthorized and/or unlawful use. Although AltiGen Communications, Inc.
Contents CHAPTER 1 Overview and Installation . . . . . . . . . . . . . . . . . . 1 Licensing . . . . . . . . . . . . . . . . . . . . . . . System Requirements . . . . . . . . . . . . . . Pre-Installation Checklist . . . . . . . . . . . . Installing MaxInSight on a Client System Uninstalling MaxInSight . . . . . . . . . . . . . . . . . . . . . . . . . . . . . . . . . . . . . . . . . . . . . . . . . . . . . . . . . . . . . . . . . . . . .1 .1 .2 .2 .3 CHAPTER 2 Getting Started . . . . . . . . . .
iv MaxInSight Manual
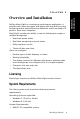
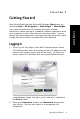
CHAPTER 1 AltiGen MaxInSight is a workgroup performance application. It provides call center managers and agents with the ability to track workgroup status and performance data from a wall-mounted LCD panel or from their computers.
• 1GHz CPU or faster • 1GB available hard drive disk space • 1GB RAM • SVGA monitor (1024 x 768) with 256 color display, or better • Keyboard and mouse • MAX Communication Server ACC 7.0 Update 1 or MAX Communication Server ACM 7.0 Update 1 running on a server accessible to this client. Pre-Installation Checklist Before installing MaxInSight, make sure the following is done: • MAXCS ACC/ACM 7.0 Update 1 has been installed on the system server.
Uninstalling MaxInSight From the Windows Start menu, select Control Panel > Add/ Remove Programs > MaxInSight 7.0 Update 1 to uninstall MaxInSight. 2. Click Remove, and respond to any additional prompts. MaxInSight Manual 3 Overview and Installation 1.
4 MaxInSight Manual
CHAPTER 2 Getting Started Start MaxInSight from the Microsoft Windows Start menu, by choosing Start > All Programs > MaxInSight > MaxInSight. Logging In 1. If this is your first login to this MAX Communication Server ACC/ACM system, enter the system server’s IP address or the name of the system server you will be using. To obtain the server name or IP address, ask your system administrator. (Subsequently, when you log in, you’ll see the IP address in the Server field.) 2.
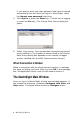
If you want to store your login password and have it entered automatically the next time you log in to MaxInSight, check the Always save password check box. 3. Click Sign in or press the Enter key. (To back out of logging in, press the Esc key.) The Choose Data Source dialog box opens: 4. Select a log service. Only enabled and connected log servers can be selected.
Getting Started Figure 1. MaxInSight main window with the Configure menu opened MaxInSight remembers the workgroups you enable, and the configuration and position of views, so when you log in again, the remembered workgroups are enabled automatically, and the views are displayed as they were when you logged out. Making Workgroups Available for Monitoring Before you can monitor a workgroup, you must enable it. To do so, choose Configure > Configure WG to Monitor.
Click a column head to sort the column in ascending or descending order All workgroups configured in your company’s MAX Communication Server are listed in this dialog box. Select a workgroup you want to monitor, and click the Enable button. Enter the workgroup password when requested. Repeat for each group you want to monitor. Workgroups you enable will be available to you in other MaxInSight configuration screens. When finished, click OK. To disable a workgroup, select it and click the Disable button.
Full Screen enlarges a view to fill the screen and hides the MaxInSight title bar and menus. To get the MaxInSight main window and its menus back, press Ctrl+U (Ctrl+U is a toggle) or the Esc key. You can also right-click on the border of the MaxInSight screen (not within a view) and choose View > Full Screen/Restore. Arrange View fills the MaxInSight window with an orderly distribution of each view. For an example, see the next figure.
Figure 2. Result of choosing the View > Arrange View command to display five configured views Changing the Skin You can select a skin for MaxInSight. The skin defines the title bar and border of the main MaxInSight window and view windows. Choose Configure > Configure Skin.
Getting Started In this dialog box, you can • Select a skin (the display in the dialog box changes to show you what the skin looks like) • Specify font name and color for the title window of views • Specify a background image for the main window by clicking the Choose button to open a dialog box: MaxInSight Manual 11
Choose a .bmp image file from any folder, and click the Open button. • Choose to remove the AltiGen logo from the background of the Main window by clearing the Display AltiGen logo on the background check box.
CHAPTER 3 Configuring Data Displays After you have enabled the workgroups you want to monitor (Configure > Configure Workgroup to Monitor), you can then configure the data displays you want to see. Configuring Workgroup Data Displays You can display rows of workgroup data in the following ways: • One workgroup only time • Multiple workgroups on display at the same time In addition to row views, you can also create gauge views, time line views, and bar views.
Select workgroups to view Highlight a field to see it described here 1. To select a workgroup, highlight it and click the Right-arrow button. You can select multiple workgroups to monitor, but in this configuration only one workgroup view at a time is displayed. When multiple workgroups are selected, the data of each one is displayed in rotation.
explanation of each field (appearing just above the fields list), highlight the field. Use Shift+click to select multiple adjacent fields. Use Ctrl + click to select multiple non-adjacent fields. Then click the Right-arrow button to move them to the right-hand column. To remove fields, select them and click the Left-arrow button. You can change the order of selected fields by highlighting a field and clicking the Up or Down buttons. 3.
Configuring Simultaneous Row-Type Views of Multiple Groups To configure simultaneous row views of multiple workgroups, choose Add > Add Multiple Workgroup View. The configuration dialog box for multiple workgroup views is similar to that for a single workgroup display. To configure, see the steps in “Configuring for a Single Row-Type Display” on page 13. In a multiple workgroup view, each workgroup’s data is displayed in a separate row. The first column displays the number of the workgroup.
Figure 2. Data from two workgroups displayed, each in its own row In addition to the basic row views, you can configure four other views: Gauge – used to show the real time status of a single data value in a dial format. Timeline – used to display trends of data elements over time. The data points are plotted on the graph and connected with lines. Vertical or Horizontal Bars – used to display one field of either one workgroup or multiple workgroups in a vertical or horizontal bar view.
1. Choose Add > Add Gauge View. 2. Specify the workgroup, the field to track, and a value range. Note: Only the fields appropriate to a gauge view are available 3. Select a font and color for the workgroup and for the field name. 4. Click OK. You see a gauge similar to the next figure: Figure 3.
Time Line View A time line view is used to display trends of data elements over time. The data points are plotted on a graph and connected with lines. To set parameters for a time line view, Choose Add > Add Time Line View. 2. Select one or more workgroups. To select a workgroup, highlight the workgroup and click the Right-arrow button. 3. To specify the color of the lines, highlight a selected workgroup, click Set Color and select a color. Repeat for each additional workgroup. 4.
5. In the Value Range fields, specify a value range for the field you want to chart. 6. Specify the period for which you want to display statistics: either the last x hours (select from 1-24), or a time period you specify in the From and To fields (24-hour clock). Be sure the time you select in the From field precedes the time you select in the To field. 7. Select a time interval: 15 minutes, 30 minutes, or one hour. 8. Click OK. A time line view is displayed.
1. Choose either Add > Add Vertical Bar View or Add > Add Horizontal Bar View. The following dialog box appears. 2. Select History to display historical data, or select Real Time to display real time data, and click OK. A dialog box opens where you can set parameters.
1. Select one or more workgroups. To select a workgroup, highlight the workgroup and click the Right-arrow button. 2. To specify the color of the bars, highlight a selected workgroup, click Set Color and select a color. Repeat for each workgroup selected. 3. To change the order of workgroups in a view, highlight a selected workgroup and click the Up or Down button. 4. Select a field to chart from the Select Field drop-down list.
If you selected Real Time in the Bar View Display Mode dialog box, the following dialog box opens: 1. Select a workgroup. 2. Select a field to view. 3. Specify a value range for the field you want to view. 4. Click OK. A bar view is displayed. The workgroup number and display color are shown at the top. MaxInSight Manual 23 Configuring Data Displays Figure 6. A horizontal bar view showing history data for abandoned calls in two workgroups. (No calls were abandoned.
Figure 7. Vertical bar view showing number of abandoned calls for a workgroup. (No calls were abandoned.) Changing the Parameters of a View To change the parameters of a view you’re displaying in MaxInSight, right-click the view, and choose Modify View Parameters. Make your changes in the Parameters dialog box and click OK.
Configuring Alerts For each field you’re interested in tracking, you can choose to be alerted when data in the field crosses a threshold you specify (a warning threshold and a critical threshold). MaxInSight alerts you through a different color display and, optionally, by playing a sound file. To configure alerts for a field, Choose Configure > Configure Alerting. 2. Select the display colors you want to use for normal, warning and critical levels.
The workgroup number The field you selected is described here The dialog box varies, depending on the field you selected 5. Select Upward or Downward, as appropriate, configure the field’s threshold(s), and click OK. Your configuration is displayed in the Alerting Configuration dialog box. Note: If you select Downward, the Normal above field is filled in automatically when you specify the warning level.
select a file from the Sound File drop-down list. You can click the Play button to preview the sound. Note: Wave files are stored in the WAV folder under the MaxInSight folder. You can add your own sound file to this folder, and it will appear in the selection list. The duration of your sound file should be less than 5 seconds. Note: Only one sound file can be used per workgroup. 7. When you are finished configuring, click OK. Figure 8.
Workgroup queue real time status fields Agent availability status fields Daily performance statistics fields 28 MaxInSight Manual
Index Symbols F ? in display data 15 fields definitions 13, 27 descriptions 25 list 27 font color, changing 10 font, changing 10 A alerts, configuring 25 always save password 6 arranging views 8 B background image, changing 10 bar view, configuring 20 broken connection 6 C changing background image 10 look of MaxInSight 10 number of digits displayed 15 view parameters 24 configuration, remembered 7 configuring alerts 25 data displays 13 skin 10 connection with server broken 6 D data displays configur
P password, always save 6 R real time display mode 20 reconnecting 6 required license 1 requirements, system 1 restore MaxInSight menus 9 rotate interval 15 rotating display 13 row count 15 rows, displaying multiple 15 row-type display 13 row-type views multiple workgroups, displaying simultaneously 16 S server IP address 5 single workgroup view 13 skin, changing 10 sound file adding 26 configuring 26 starting MaxInSight 5 statistics period 20, 22 system requirements 1 V vertical bar view, configuring 20