
User guide


7–2 Chapter 7: Power Measurement
Power Design Example
Cyclone III FPGA Development Kit User Guide September 2010 Altera Corporation
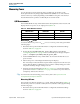
The LEDs in Table 7–2 indicate the power-state values of the design example as
User_PB1 advances frequency.
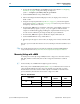
The LEDs in Table 7–3 indicate the power-state values of the design example (and
number of output pins, when enabled by User_PB3) as User_PB2 advances resource
utilization.
The resource state (Table 7–3) controls the number of I/O pins used. Each resource
increment adds 8 additional I/O pins (Table 7–3). Similarly, the overall design
frequency (Table 7–2) sets the toggle frequency of these I/O pins.
Table 7–2. Power State Indicators for Frequency
LED1 (AE20) LED0 (AD15) Frequency (MHz)
000
0133
1067
1 1 100
Table 7–3. Power State Indicators for Resources
LED6
(AG19)
LED5
(AC17)
LED4
(AE15)
LED3
(AD19)
LED2
(AF18)
Resources
(%)
Number of
Outputs
0000058
000011016
000101524
000112032
001002540
001013048
001103556
001114064
010004572
010015080
010105588
010116096
0110065104
0110170112
0111075120
0111180128
1000085136
1000190144
1001095152