
User`s manual
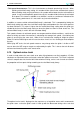
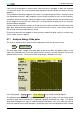
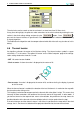
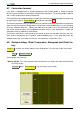
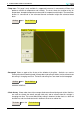
Table Of Contents
- Introduction
- User Interface
- Display Elements
- Cross Country Tasks
- Glide Computer
- Atmosphere and Instruments
- Airspace, Traffic and Team Flying
- Avionics and Airframe
- Quickstart
- InfoBox Reference
- Configuration
- Data Files
- About XCSoar
- GNU General Public License
6 ATMOSPHERE AND INSTRUMENTS
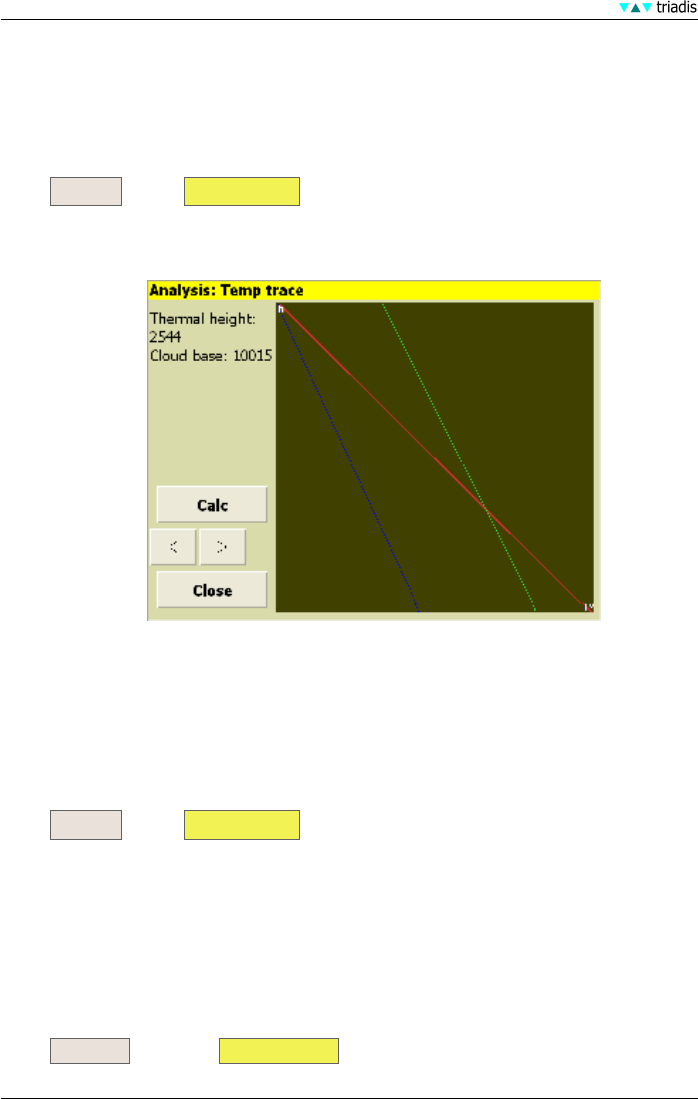
• Temp trace This page is only available if a supported instrument is connected to XCSoar that
produces outside air temperature and humidity. The chart shows the variation of dry air
temperature, dew point temperature and outside air temperature with height. The convection
forecast is summarised as the estimated thermal convection height and estimated cloud
base.
Settings opens Basic Settings .
• Barograph Shows a graph of the history of the altitude of the glider. Statistics are used to
estimate the thermal working band (average base and ceiling of climbs) and to estimate how
the ceiling is changing over time. The base and ceiling lines are drawn on the barograph.
Settings opens Basic Settings .
XXXXXX GRAPHIC
• Climb history Shows a bar chart of the average climb rate achieved during each climb. Statistics
are used to estimate the overall average climb rate, and to estimate how this average is
changing over time. The current MacCready setting is drawn on the bar chart as a thick red
dashed line, and the climb rate trend is drawn on the chart as a blue line.
Task calc opens the Task calculator .
63 XCSoar Manual (Altair version) • XCSoar-A-EN