
User`s manual
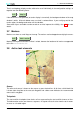
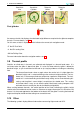
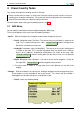
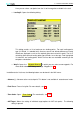
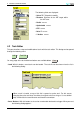
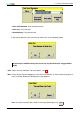
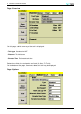
Table Of Contents
- Introduction
- User Interface
- Display Elements
- Cross Country Tasks
- Glide Computer
- Atmosphere and Instruments
- Airspace, Traffic and Team Flying
- Avionics and Airframe
- Quickstart
- InfoBox Reference
- Configuration
- Data Files
- About XCSoar
- GNU General Public License
3 DISPLAY ELEMENTS
Start/finish Start/finish Taskpoint Taskpoint
Line Cylinder Sector AAT
Final glide bar
An arrow on the left side displays the calculated height difference required for the glider to complete
the task. For more details, see 5.8.
On this arrow, a letter is displayed, which indicates the current task navigation mode:
• T NavTo Task Point
• L NavTo Landing Point
• W NavTo Way Point
For more information about the navigation modes see 4.1.
3.9 Thermal profile
Statistics on climb rates in thermals are collected and displayed in a thermal band meter. It is
not shown when the glider is above final glide. It is also not shown when the glider is below the
break-off height, as you should then be focused on just staying airborne or finding an outlanding
field.
The thermal band meter shows a graph, where the vertical axis is height above the
break-off height, and is scaled according to the maximum height achieved. The hor-
izontal axis is the average climb rate achieved at a particular height band. The hori-
zontal axis is scaled according to the MacCready setting, and an arrow indicating this
setting, and the glider’s current height is overlaid on the shaded area. This scaling
and arrow makes it easy to see how the pilot’s MacCready setting compares with
achieved thermals and to plan the desired working height band.
When cruising between thermals, the vertical position of the arrow, indicating the glider’s height
relative to the thermal band, can be used as a reference to suggest how urgent it is to find the next
thermal. As the arrow approaches the bottom of the band, then the glider is nearing the break-off
height and the pilot should consider taking even a weak thermal.
3.10 Other
The following symbols display different informations concerning flight mode and GPS:
27 XCSoar Manual (Altair version) • XCSoar-A-EN