
User manual

XCSoar User Manual
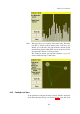
INFO . Analysis
Several pages are of interest:
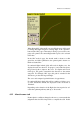
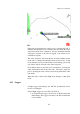
Barograph : Shows a graph of the history of the altitude of the glider.
Statistics are used to estimate the thermal working band (av-
erage base and ceiling of climbs) and to estimate how the
ceiling is changing over time. The base and ceiling lines are
drawn on the barograph.
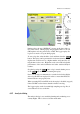
The ‘Settings’ button opens the basic settings dialog (e.g. to
adjust the QNH)
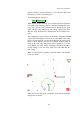
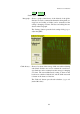
Climb history : Shows a bar chart of the average climb rate achieved during
each climb. Statistics are used to estimate the overall aver-
age climb rate, and to estimate how this average is changing
over time. The current MacCready setting is drawn on the
bar chart as a thick red dashed line, and the climb rate trend
is drawn on the chart as a blue line.
The ‘Task calc’ button opens the task calculator, (e.g. to ad-
just the Mc value)
68