
User`s guide


Management Menus
30
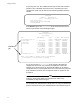
To display module statistics per counter:
1. Select a counter from the Module Statistics menu.
For example, enter T to see the Total Frames graph, similar to
the following:
2. Press Return to go back to the Module Statistics menu.
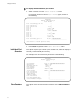
Individual Port
Overview
This option requires you to enter a port number first, and then displays a
summary of the selected port’s activity.
For example, Port 3’s overview may be similar to the following:
Zero Counters This option clears all of the statistics counters on the entire module to
zero.
Sunnyvale
Module 1—Accounting A
Total Frames
Port 1:Secondary port->13 0 |
Port 2:Room 1150 0 |
Port 3:Room 1151 2031 |
Port 4: 0 |
Port 5: 33414 |###
Port 6: 16707 |#
Port 7: 66828 |#######
Port 8: 0 |
Port 9: 50121 |####
Port 10: 0 |
Port 11: 16707 |#
Port 12: 33414 |###
Port 13:Primary port->1 116949 |#############
-----------------------
(hit Return to resume previous menu)
Sunnyvale
Module 1-Accounting A
Port 3
Good Frames: 2163304 |######################
CRC Errors: 124456 |##
Alignment Errors: 93342 |#
Runt Frames: 31114 |
Long Frames: 0 |
Bad Frames: 248912 |####
Total Frames: 2412216 |######################
Port Collisions: 0 |
Late Collisions: 0 |
Short Events: 0 |
Jabber Lockups: 0 |
Port Partitions: 0 |
Data Rate Mismatches: 0 |
Source Address Changes: 0 |
------------------------