
User`s guide


Management Menus
28
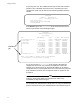
Statistical information for the entire hub, specific modules, or all
ports is displayed in the form of graphs. The graphs dynamically
change as frames pass through.
2. Press Return to go to the Hub Statistics menu.
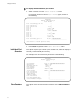
To display statistics per module:
1. Select a counter from the Hub Statistics menu.
For example, enter TO to see the Total Frames graph, similar to
the following:
Module 7 is not included in the above example because it is a
switch; therefore, the master module cannot report on its statistics.
NOTE
On a standalone hub, this graph is never displayed. If you select an
Ethernet frame from Hub Statistics, a port-by-port graph is shown
instead of a module-by-module graph.
2. Press Return to go to the Hub Statistics menu.
Individual Port
Overview
This option requires you to enter a port number first, and then displays a
summary of the selected port’s activity. When you select the option from
the Hub Statistics or the main menu, the port belongs to Module 1 by
default, unless you first select a different module number from the main
menu before Individual Port Overview.
Zero Counters This option clears all of the statistics counters on the entire module to
zero.
Sunnyvale
Total Frames
Module 1—Accounting A: 2412216 |######################
Module 2—Accounting B: 123264 |####################
Module 3—Marketing A: 102720 |####################
Module 4—Marketing B: 87312 |#############
Module 5—Engineering: 112992 |######################
Module 6-Manufacturing: 92448 |#############
-----------------------