
Manual


Chapter 37: Statistics
336 Section II: Using the Web Browser Interface
– 15 seconds
– 30 seconds
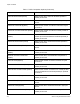
5. To select the color of the traffic comparison graph, select Color.
Choose one of the following colors:
– Green (This is the default.)
– Blue
– Red
– Purple
– Yellow
– Orange
– Gray
– Light Red
– Light Blue
– Light Green
– Light Yellow
– Light Gray
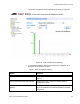
6. To create the Error Group Chart, select Draw.