
Manual
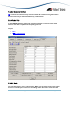
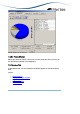
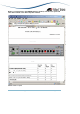

RMON Statistics 3-D Pie Chart tab
7.2.6.1 Popup Display
When you move the mouse cursor onto a section of the pie chart, the value of
the data for the selected area is displayed.
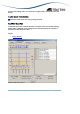
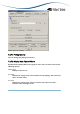
7.2.7 Options Tab
In the Options tab, you can customize the display options or edit the statistics
data.
Topics:
• Polling Interval
• Display Data Type of Chart
• Regist Menu
• Save Polling Data
• Start Snapshot
AlliedView™-EMS 3.10 Device Manager User’s Guide Page 95 of 133