
Manual

AlliedView™-EMS 3.10 Device Manager User’s Guide Page 93 of 133
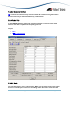
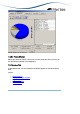
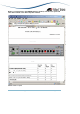
RMON Statistics Plot Chart tab
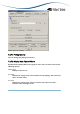
items in descending order. To restore the original order, click the Reset Table
button.
7.2.4.2 Reset Table Button
: Reorders table items after using sorting function.
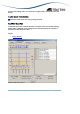
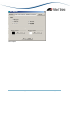
7.2.5 Plot Chart Tab
In the Plot Chart tab, network statistics are shown in the time-scaled plotting
graph. Data is updated at the polling interval. The horizontal axis contains a
maximum of the 40 latest values.
Topics:
• Popup Display