
Manual

AlliedView™-EMS 3.10 Device Manager User’s Guide Page 32 of 133
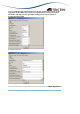
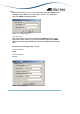
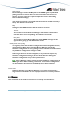
Ex 2: After adjustment
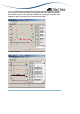
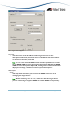
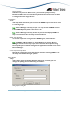
Example 2: Adjusting the boundary between graph and table. To do this, position
your pointer on the border between the graph and the table. When the pointer
has transfomed into arrows, left click on the border and drag it to the left while
holding the left mouse button to increase the table width.
Ex 2: Before adjustment