
User Manual


Qu Mixer Reference Guide 51 AP9372 iss.8
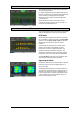
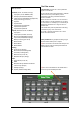
10.5 Home Screen – Meters
This screen provides a convenient view of all channel,
mix and FX signal activity.
For optimum performance the loudest signals should
read into the yellow. If any red Peak meter flashes then
reduce the level of that signal to avoid possible
distortion. Increase levels if the meter readings are
consistently low.
The Qu-24 meters screen is shown here. Qu-32
provides two pages of meters. The Qu-16 does not
include Group and Matrix meters.
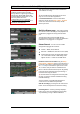
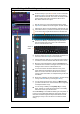
10.6 Home Screen – RTA
This screen displays a Real Time Analyser (RTA) which
analyses the frequency content of the audio signal.
RTA Mode
The RTA follows the PAFL signal. Select any channel,
mix or FX PAFL to analyse its signal. If the LR to PAFL
option is on in the Setup / Audio / PAFL screen then
the RTA will show the LR mix when no PAFL is
selected.
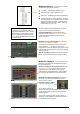
The RTA splits the frequency into 31 third octave
bands from low 20Hz to high 20kHz, the same
frequencies as used on a graphic equaliser. The
dominant ‘Peak Band’ frequency displays in red.
The RTA is a useful tool to help you identify problem
frequencies such as room resonance and feedback.
The iPad Qu-Pad app can also show a display of the
RTA peak band (most dominant frequency).
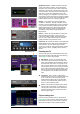
Spectrogram Mode
Firmware V1.8 introduced a second mode for the RTA.
Press the Fn key to access the Spectrogram or to
return to the RTA.
The Spectrogram presents a visual representation of
the spectrum of frequencies in the signal as they vary
with time. The amount of energy is displayed using
colour from dark blue low level to red peak level. The
screen presents an 8 second window to give you a
history of the changes over time.