
Troubleshooting guide


13 — Monthly maintenance tasks
13-6 Alcatel-Lucent 5620 Service Aware Manager
5620 SAM
System Administrator Guide
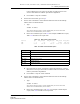
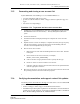
Code 13-4: Solaris iostat output example
extended device statistics
device r/s w/s Kr/s Kw/s wait actv svc_t %w %b
sd1 0.1 0.2 0.9 3.3 0.0 0.0 34.3 0 0
sd3 0.1 0.5 1.1 3.7 0.0 0.0 73.1 0 90
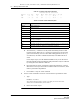
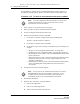
Table 13-4 Solaris iostat field description
iii The %b and svc_t columns are the key fields determining whether a disk
bottleneck exists. When the svc_t is between 30 and 50 ms, and the %b is
greater than 20% busy, there is a minor disk loading problem. If the svc_t
exceeds 50 ms, the disk is considered I/O-bound, and a disk bottleneck
exists.
In the sample output, the sd3 disk had 90% disk activity in the %b column.
Because disk sd3 is busier than disk sd1, disk performance may be enhanced
by moving data from disk sd3 to disk sd1.
iv Record the data for future comparison of platform performance. Look for
differences in the output of the data for similar loads on each station, which
indicate performance degradation.
v Press CTRL-C to stop the iostat command.
9 Use the netstat command to check for network interface performance issues.
i Type:
netstat -i time ↵
where time is the time period, in seconds, over which you need to collect data.
Alcatel-Lucent recommends that you start with 5 s.
ii Review the netstat output.
Heading Description
device Name of the device
r/s Reads per second
w/s Writes per second
Kr/s Reads per second (kb/s)
Kw/s Writes per second (kb/s)
wait Average number of transactions waiting for service (queue length)
actv Average number of transactions actively being serviced (removed from the queue
but not yet complete)
svc_t Average service time in ms
%w Percentage of time there are transactions waiting for service (non-empty queue)
%b Percentage of time the disk is busy (transactions in progress)
Release 12.0 R6 | November 2014 | 3HE 08861 AAAF TQZZA Edition 01