
User Guide


OmniVista SafeGuard Manager Administration Guide
78
Chapter 4: Visualization
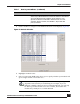
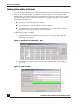
Viewing Visualization Data
Visualization allows administrators to track what a user is doing, what applications are
being used, and what is being done to a network. Such tracking is useful for forensic and
postmortem purposes, that is, for debugging and ensuring that the network is
performing at its optimum and there are no threats to the network. SafeGuard collects
this data (traffic flow, Layer 7, malware events from the CPU, policy events from policy,
and authentication events from Auth) and periodically pushes it in tabular format to
OmniVista SafeGuard Manager as visualization data.
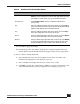
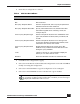
Visualization data can be viewed in tabular format for the following objects:
Table 10 Visualization Data Objects
Table Type Description
Policy Incidents Displays a list of all policy incidents against a user. For more information,
see Viewing Policy Incidents.
Malware Incidents Displays a list of malware incidents. This table also displays the counts of
various severities of the infection events. For more information, see
Viewing Malware Incidents.
Posture Incidents Displays all posture incidents, including EPV incident ID, host IP and MAC
addresses. For more information, see Viewing Posture Incidents.
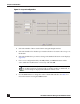
User Sessions Displays user authentication and bandwidth usage that is aggregated
for each user. Typically this has a navigation tree on the left panel that
helps finds users belonging to a specific group/role or connected to a
specific port of a specific device. For more information, see, Viewing
User Sessions.
Application Type Displays the user bandwidth usage that is aggregated for each type of
application. For more information, see Viewing Application Types.
Application Instance Displays the user bandwidth usage for each user, application type,
destination port, and destination IP address. For more information, see
Viewing Application Instances.
Application Flows Allows an administrator to view application flows for a selected user or
application. For more information, see Viewing Application Flows.