
User Guide


OmniVista SafeGuard Manager Administration Guide
64
Chapter 4: Visualization
The Network Awareness dashboard displays the following information:
■ Top 10 User Sessions by Bandwidth
■ Top 10 User Sessions with Most Blocked Incidents
■ Top 10 Destinations
■ Top 10 Web Sites
■ Top 10 Applications by Flow Count
■ Bottom 10 Applications by Flow Count
■ Top 10 Applications by Bandwidth (Bar Chart)
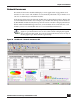
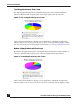
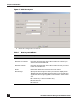
Top 10 User Sessions by Bandwidth
The Top 10 User Sessions by Bandwidth table displays the name and usage of the top 10
user sessions by bandwidth. The bandwidth is shown in terms of percentage (%) usage.
Figure 39 Top 10 User Sessions by Bandwidth
Click on the column header to display a list of users, including all user details. For more
information on viewing user details, see Viewing User Sessions.
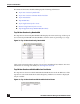
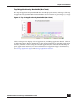
Top 10 User Sessions with Most Blocked Incidents
The Top 10 User Sessions with the Most Blocked Incidents shows the IP addresses of the
top 10 user sessions that had the most blocked policy incidents. Username is displayed
only if available.
Figure 40 Top 10 User Sessions with Most Blocked Incidents