
User Guide


OmniVista SafeGuard Manager Administration Guide
63
Chapter 4: Visualization
Network Awareness
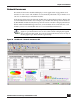
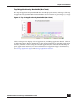
The Network Awareness dashboard displays various application usage patterns and
statistics for active users. The modules are automatically refreshed every 5 minutes. You
can also use the F5 key to refresh the modules.
In the Network Awareness dashboard, double-click on the module header to display the
associated detail information. For example, if you double-click the Top 10 User Sessions
by Bandwidths module header, the Top 10 User Sessions window is displayed with user
details and the bandwidth usage. However, some modules allow row details. For such
modules, select a row and double-click to see associated detail information.
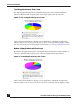
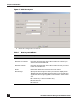
Figure 38 Dashboard - Network Awareness Tab
NOTE: You can right click on any module to display the details in either a bar
graph or a pie chart format. You can also select to hide or display the legend
that accompanies the graph. You can also position the mouse cursor on any of
the bar graph or pie chart element to get tooltips.