
User Guide


OmniVista SafeGuard Manager Administration Guide
204
Chapter 8: Audit Logs and Statistics
Server Health
OmniVista SafeGuard Manager allows you to collect, view, and store statistics relating to
server health. These statistics are helpful in analyzing server performance.
Administrators can use this drill-down capability to view server CPU and memory
performance, OmniVista SafeGuard Manager client connections, Layer 7 events, and any
application or flows processed. The following parameters are collected as part of server
health:
■ Memory
■ CPU
■ Disk
■ Number of OmniVista SafeGuard Manager users
■ Number of flows processed
■ Number of Layer 7 events processed
Server statistics are collected periodically and stored in the database on a daily basis. The
default rate at which the statistics are collected is 1 minute and is controlled by the
ServerHealth_Interval_In_Minutes parameter in application.conf. Each day current
data replaces the data in the server health table, while earlier data is moved to the
previous day’s health table. The purging of the server health tables is performed based on
the settings you specified in the server settings. For more information, see Purging the
Database.
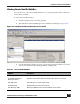
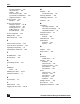
You can view server health in one of two ways:
■ Place your cursor on the settings icon located at the bottom-right corner of the
OmniVista SafeGuard Manager client window. Most recent server health
information is available as a tooltip for this icon. A sample display of current
values using tooltip is shown below.
■ Click the Statistic View icon from the Page Bar. For a detailed description of these
values, see Viewing Server Health Statistics.