
User Guide


OmniVista SafeGuard Manager Administration Guide
201
Chapter 8: Audit Logs and Statistics
Device Health
OmniVista SafeGuard Manager allows you to collect, view, and store statistics relating to
device health. These statistics are helpful in analyzing each device’s performance and its
current connections. Administrators can use this drill-down capability to view device
CPU and memory performance, fan or power failure, and any device operation success
or failure messages. For more information on enabling device health statistics and the
collection interval, see General. The following parameters are collected as part of device
health:
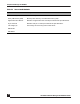
■ Current CPU Usage
■ Current memory usage
■ Disk I/O
■ Hardware status (fan failure, power supply failure, temperature
You can view device health in one of the following ways:
■ Click on the View Statistics icon in the Page Bar. This view displays the statistics
for both OmniVista SafeGuard Manager server health and device health.
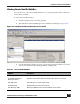
■ Click on the Device Heath Statistics node in the navigation tree. You can expand
this node to view all devices. Select an individual device to view the most recent
statistics or statistics for a specified time range.
■ Select the Health tab from on the Device Configuration screen. This tab displays
the most recent device health statistics for the selected device. Once the tab is
active, data is automatically refreshed every 5 minutes.