
User Guide


OmniVista SafeGuard Manager Administration Guide
20
Chapter 1: Getting Started
Navigation
When you log into the OmniVista SafeGuard Manager command center, a navigation
panel displays that allows you to access the various features by simply clicking a button
or using a menu item. You can navigate the OmniVista SafeGuard Manager command
center using the following:
■ Dashboards
■ Menu Bar
■ Page Bar
■ Action Bar
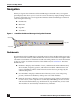
Figure 4 OmniVista SafeGuard Manager Navigation Elements
Dashboards
The OmniVista SafeGuard Manager command center has three dashboards that provide a
high-level network summary. These dashboards can be used to further investigate either
actionable user incidents or informational and user traffic patterns. For more information
on how to use the visualization features of the dashboard, see Visualization. The three
dashboards are:
■ Incidents—Displays total number of users, authenticated and unauthenticated,
device health, and policy, posture, and malware incidents. Administrators can
remove offending machines off the network and revoke user privileges by de-
authenticating users.
■ User Incidents—Displays authentication failures by users, users with policy,
posture, and malware incidents, and top user roles with incidents.
■ Network Awareness—Displays various application usage patterns and statistics
for active users, such as top 10 user sessions by bandwidth, top 10 user sessions
with most blocked incidents, top 10 destinations, top 10 Web Sites, and so forth.
The modules are automatically refreshed every 5 minutes.
Menu Bar
Page Bar
Action Bar