
User Guide


OmniVista SafeGuard Manager Administration Guide
168
Chapter 6: Query and Reports
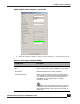
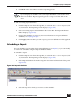
3 Enter the information as shown below:
4 Click Apply. The next time you run your scheduled or ad hoc report, this query
definition is applied.
Table 42 Report Definitions
Define Description
Name Specify a textual name for the report.
Description Specify a description for the report you are creating.
Time Window Select Relative to specify a relative time for the query: daily,
hourly, weekly, or monthly. You can also select how many hours
per day for which you want the reporting data.
Select Absolute to enter a specific time. Use the dropdown lists in
the From and To fields to enter a specific calendar date and time
to be used as the start date and time and end date and time for
the query.
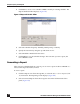
Query Templates The Query Templates tab shows a list of available queries.
Highlight the query on which you want reporting to be done and
click Select to add the query to the Selected box. When you
select a query template and click Select, an Add Template to
Report dialog box displays that allows you to configure Time Filter
and Active Status on the report. Use the up/down arrows to select
a Time Filter (Occurred During, First Occurred During, Last
Occurred During). Configure the Active Status as Active, Inactive,
or Active or Inactive.
Note: Depending on the query you select, the choices for Time
Filter might be different.
After you have added all the queries you want in your report, you
can arrange the order in which you want to view the data:
Top: to move a query to the top of the list.
Up: to move a query one level up.
Down: to move a query one level down.
Bottom: to move a query to the bottom of the list.
Dashboard Modules The Dashboard Modules tab shows a list of all available
predefined dashboard modules that can be included in a report.
Select the module that you want to include and click Add. After
you have added all the modules that you want in your report, you
can adjust the placeholders for the module chart by using the
Top, Up, Down, and Bottom buttons.
Query Description Displays the description for the selected query.