
Instructions


18
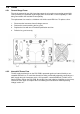
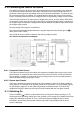
7.2 The Display and the Home Screen
All parameter settings and meter readings are shown on the backlit liquid crystal display (LCD).
At power up the instrument initialises to the home screen, which is the normal display during
operation of the unit. This screen displays all of the load meter readings and the most important
load parameter settings as described below, and is also the top level of the soft-key driven menu
structure. The display changes to show other screens as selections are made to enter parameter
values and then returns to the home screen when entry is complete.
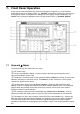
7.2.1 [A] Status Line
The status line of the instrument is visible along the top of the display at all times except when
one of the store, recall or utilities menus is being shown. It indicates the current status of the
instrument as follows (in order, from left to right across the display):
• The load mode field indicates the present load mode – CC, CP, CR, or CG.
• Slow is displayed when slow start operation has been enabled.
• Slew is displayed as a warning when the present slew rate setting is too slow with
regards to the level difference, transient frequency and duty cycle, see ‘Slew Rate’ section
7.14.
• Lim is displayed when either of the user defined current or voltage limits is enabled.
• The level select field (in the centre) indicates which input level or control method is
currently selected – Level A, Level B, Transient, Ext V or Ext TTL.
• The LAN field indicates the status of the Local Area Network (if fitted). When there is no
LAN connection the field displays
. While a connection is being established the
indicator will flash between
and , and then while connected the field will show .
See the ‘Remote Interface Configuration’ chapter for more information.
• The input status field (at the right hand end) indicates the instrument’s present load input
condition – Disabled, Enabled, Low Voltage, Dropout, Power Limit or Fault, as
described in the paragraph on ‘Input Condition Lamps’ section 6.8.
7.2.2 [B] Home Screen Data
Below the status line are the meter displays which show the actual measured source voltage and,
once the load is enabled, the load current.
7.2.3 [C] Settings Data
The screen is divided into three areas. On the left, under the heading METERS, the display
shows the present power in the load and the equivalent resistance; these values are computed
from the measured voltage and current readings. Any of these meter displays will show
HIGH (or
MAX for power) if the measured value is beyond the capabilities of the unit.
In the centre, under the heading
LEVELS, the display shows the present settings for Level A and
Level B (the units depend on the operating mode) and the Dropout Voltage setting.
On the right, under the heading
TRANSIENT, the display shows the settings for the Frequency
and Duty cycle of the internal oscillator, and the Slew Rate of the transitions.
All six of these parameters can be modified either by direct numeric entry or by using the knob to
increment or decrement the present value.