
User`s guide


264 VEE User’s Guide
6 Creating Reports Easily Using ActiveX Chapter
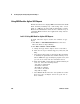
Creating an Agilent VEE to MS Excel Template
In this exercise, you will create a program to display an array of
VEE test data in MS Excel. You can use this program as a
template for displaying the results of other tests in MS Excel
spreadsheets.
Lab 6-2: Creating an Agilent VEE to MS Excel Template
1 Open results_average.vee.
2 Change the For Range object to loop 10 times.
3 Add the input B to Fill in Cells and change the statement inside
to read: sheet.cells(A+1,1) = B[A-1].
4 Click Device ⇒ Formula, rename it to Array of Test Data,
and enter the embedded functions randomize(ramp(20),
4.5, 5.5) to create a random array of 20 elements with
values from 4.5 to 5.5. Delete the input pin and connect the
data output pin to the B input of Fill in Cells.
5 Change the range in the Formula box on the bottom of the
screen from A21 to A11. The statement should now read:
set range = sheet.range(“A2:A11");
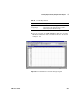
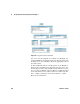
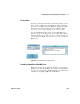
6 Save the program as report_template.vee and run it. Compare it
to the Excel worksheet as shown in
Figure 155 and the
complete program as shown in Figure 156.