
User`s guide


Analyzing and Displaying Test Data Chapter 4
VEE User’s Guide 199
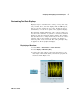
You will see two white arrows pointing up and down at one
of the data points on the waveform. Also, notice that the
display records the x and y coordinates of these markers at
the bottom of the display. To measure the x or y distance
between two peaks, click- and- drag the arrows to the peaks
you want to measure. You will see one of the markers move
to those new peaks with the new coordinates recorded at
the bottom of the display, as shown in Figure 125.
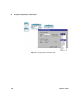
Figure 125 Delta Markers on a Waveform Display
VEE will automatically interpolate between waveform data
points. Open the object menu, select Properties, then under
Markers, click MarkerInterpolate.