
User`s guide


198 VEE User’s Guide
4 Analyzing and Displaying Test Data Chapter
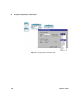
Figure 124 Displaying a Waveform
Changing the X and Y Scales
1 Double- click the Waveform (Time) title bar to get the Y
Plot Properties box, select the Scales folder, select 20m for
the X Maximum and enter 1m.
This alters the time span of the display from 20
milliseconds to 1 millisecond.
2 Double- click the Minimum field on the Y axis where it
says -1, and enter - .5. Click OK.
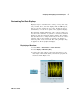
Zooming in on Part of the Waveform
1 Open the Waveform (Time) object menu and click Zoom ⇒
In.
The cursor becomes a small right angle. By clicking and
dragging, you can draw a square on the graph outlining
the area you want to enlarge.
2 Outline an area of the waveform including several peaks,
and release the mouse button.
The display zooms in to this selected area of the
waveform. Notice the x and y scales change automatically.
Adding Delta Markers to the Display
1 Move to the open view on the Noise Generator.
a Change the Num Points setting to 16. Run the program
again.
b Open the Waveform (Time) object menu and select
Properties (or just double- click on the title bar), then
under Markers, click Delta. Then click OK.
NOTE
You can get and set the values of the markers at runtime. See the online
Help topic under Contents and Index ⇒ How Do I... ⇒ Display Data for
more information.