
User`s guide


Analyzing and Displaying Test Data Chapter 4
VEE User’s Guide 197
Customizing Test Data Displays
Displays may be customized in a variety of ways. Not only
can you label, move, and size displays like all VEE objects,
but you can also change the x/y scales, modify the traces,
add markers, or zoom in on parts of the graphical display.
The following example illustrates some of these features. It
uses the Noise Generator to generate a waveform, and then
displays it with the Waveform (Time) display. The example
also describes how to change the X scale, zoom in on a wave
segment, and use the markers to measure the distances
between points on the waveform. The same principles may
be applied to all the graphical displays.
Displaying a Waveform
1 Select Device ⇒ Virtual Source ⇒ Noise Generator.
2 Select Display ⇒ Waveform (Time).
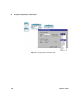
3 Connect the data output of the Noise Generator to the
data input of Waveform (Time) and run the program. It
should look like
Figure 124.