
User`s guide


Analyzing and Displaying Test Data Chapter 4
VEE User’s Guide 189
• Returning results from the MATLAB Script object and
using the results in other parts of the VEE program.
• Performing sophisticated filter design and implementation
in the MATLAB Script object by using MATLAB’s Signal
Processing Toolbox functionality.
• Visualizing data using 2- D or 3- D graphs.
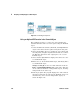
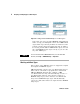
Figure 120 shows how the MATLAB Script object appears in
a VEE program. When the MATLAB Script program executes,
it generates the data shown in the Alphanumeric object.
Figure 120 MATLAB Script Object in a VEE Program
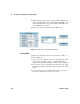
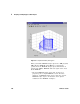
Figure 121 shows the graph that is produced when the
program runs.