
User`s guide


102 VEE User’s Guide
2 Agilent VEE Programming Techniques Chapter
Showing Execution Flow
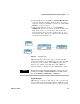
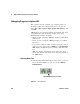
1 Click the Show Execution Flow button on the tool bar as
shown in
Figure 59. (Or click Debug ⇒ Show Execution Flow.)
Figure 59 Show Execution Flow
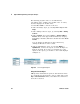
When you run the program, you will see a colored outline
around the objects as they execute.
Use Data Flow and Execution Flow to understand how a
program is operating, but turn them off to get higher
performance. Combining these features with debugging tools
such as breakpoints will help you understand how a VEE
program works and where possible errors lie.
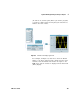
Examining Data on a Line
Checking the data at different points in your program is a
fast, useful way to debug your program. The Line Probe is a
way to view the data on a given line.
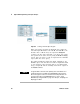
Place the mouse pointer over a data line in the detail view.
The cursor becomes a graphic of a magnifying glass. The line
and its connections are highlighted, and a box appears
displaying the data value on the line. Click the magnifying
glass cursor, and a dialog box appears with more
information about the data line. (Or click Debug ⇒ Line Probe
and click on a line.)
Show Execution Flow button on toolbar