
Technical data

16 Agilent VEE Pro 9.32 Quick Start Guide
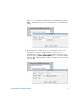
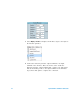
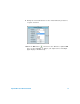
7 Connect a second line from the output of the function generator to
the input of the Magnitude Spectrum object using the same
left- click and drag method as described in Step 4.
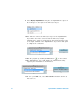
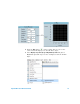
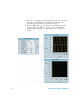
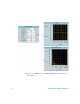
8 Click the Run button and observe the magnitude spectrum
display. As the waveform is a 200 Hz cosine, the magnitude
spectrum displayed will be a vertical line at the frequency of
200 Hz.