Agilent U2000 Series USB Power Sensors Operating and Service Guide Agilent Technologies
Notices © Agilent Technologies, Inc. 2007–2012 Warranty No part of this manual may be reproduced in any form or by any means (including electronic storage and retrieval or translation into a foreign language) without prior agreement and written consent from Agilent Technologies, Inc. as governed by United States and international copyright laws. Microsoft is a U.S. registered trademark of Microsoft Corporation.
Certification Agilent Technologies certifies that this product met its published specifications at the time of shipment from the factory. Agilent Technologies further certifies that its calibration measurements are traceable to the United States National Institute of Standard and Technology, to the extent allowed by the Institute’s calibration facility, and to the calibration facilities of other International Standard Organization members.
Safety Summary The following general safety precautions must be observed during all phases of operation of this instrument. Failure to comply with these precautions or with specific warnings elsewhere in this manual violates safety standards of design, manufacture, and intended use of the instrument. Agilent Technologies, Inc. assumes no liability for the customer’s failure to comply with these requirements. Safety Notices iv WA R N I N G A WARNING notice denotes a hazard.
Safety Symbols The following symbols on the instrument and in the documentation indicate precautions which must be taken to maintain safe operation of the instrument. Direct current On (supply) Alternating current Off (supply) Both direct and alternating current Equipotential protected throughout by DOUBLE INSULATION or REINFORCED INSULATION Three-phase alternating current Caution, risk of electric shock.
Regulatory Markings This symbol indicates that a device, or part of a device, may be susceptible to electrostatic discharges (ESD) which can result in damage to the product. Observe ESD precautions given on the product, or its user documentation, when handling equipment bearing this mark. ESD Sensitive The CE mark shows that the product complies with all the relevant European Legal Directives. ISM 1- A N10149 The C-tick mark is a registered trademark of the Spectrum management Agency of Australia.
Waste Electrical and Electronic Equipment (WEEE) Directive 20002/96/EC This instruction complies with the WEEE Directive (2002/96/EC) marking requirement. This affixed product label indicates that you must not discard this electrical/electronic product in domestic household waste. Product Category: With reference to the equipment types in the WEEE Directive Annex 1, this instrument is classified as a “Monitoring and Control Instrument” product.
General Safety Information The following general safety precautions must be observed during all phases of operation of this instrument. Failure to comply with these precautions or with specific warnings elsewhere in this manual violates safety standards of design, manufacture, and intended use of the instrument. Agilent Technologies, Inc. assumes no liability for the customer’s failure to comply with these requirements.
Environmental Conditions This instrument is designed for indoor use only. The table shows the general requirements for the product.
Declaration of Conformity (DoC) The Declaration of Conformity (DoC) for this instrument is available on the Agilent Web site. You can search the DoC by its product model or description at the Web address below. http://regulations.corporate.agilent.com/DoC/search.htm NOTE x If you are unable to search for the respective DoC, please contact yourlocal Agilent representative.
Contents Notices ii Certification iii Limitation of Warranty iii Exclusive Remedies iii Safety Summary iv Safety Notices iv Safety Symbols v Regulatory Markings vi Waste Electrical and Electronic Equipment (WEEE) Directive 20002/96/EC vii General Safety Information viii Environmental Conditions ix 1 Getting Started Introduction 2 Power Sensor Overview 3 • LED Indicator Guide 4 Principles of Operation 6 The U2000 Series USB Power Sensors in Detail 9 Initial Inspection 11 • Package Contents Checklist 11 Hard
2 Operating Information Measurement Mode 22 • Average only Mode 22 • Normal Mode 22 Power Sensor Configuration Settings 25 Measurement Accuracy and Speed 27 • Setting the Range 27 • Measurement Considerations 28 Internal and External Zeroing 30 Power Sweep and Frequency Sweep 32 Step Detection 33 Pulse Power Measurement in Average only Mode 34 3 Specifications and Characteristics Introduction 36 Specifications 38 • Frequency and Power Ranges 38 • Connector Type 38 • Maximum SWR (25 °C ±10 °C) 39 • SWR Plot
4 Service General Information 70 • Cleaning 70 • Connector Cleaning 70 Performance Test 71 • Standing Wave Ratio (SWR) and Reflection Coefficient (Rho) Performance Test 71 Replaceable Parts 74 Service 76 Troubleshooting 76 Repairing a Defective Sensor 76 Disassembly and Reassembly Procedure 77 Attenuator Disassembly and Reassembly Procedure for U2000B and U2001B 79 5 Appendix Appendix A: Zero Set, Zero Drift, and Measurement Noise 82 U2000 Series Operating and Service Guide xiii
List of Figures Figure 1-1 LED indicator sequence during power-up 5 Figure 1-2 Block diagram of the RF/microwave USB power sensor 8 Figure 1-3 Simplified block diagram of diode pair/attenuator/diode pair 9 Figure 1-4 Found New Hardware Wizard window 13 Figure 1-5 Found New Hardware Wizard driver installation 14 Figure 1-6 Hardware installation warning message 14 Figure 1-7 Completing hardware driver installations 15 Figure 1-8 USB device alias configuration 15 Figure 1-9 Agilent Connection Expert with a lis
List of Tables Table 1-1 States of LED indicator and its description 4 Table 2-1 Sensor Ranges 27 Table 2-2 Range Crossover Values 28 Table 3-1 Average only Mode Power Accuracy (with exclusions) 48 Table 3-2 Normal Mode Power Accuracy1, (with exclusions) 48 Table 3-3 Switching point 51 Table 3-4 Noise Multiplier for Average only Mode 55 Table 3-5 Settling Time for Normal and x2 Speed 59 Table 4-1 Power Sensor SWR and Reflection Coefficient for the U2000A 71 Table 4-2 Power Sensor SWR and Reflection Coeffici
xvi U2000 Series Operating and Service Guide
Agilent U2000 Series USB Power Sensors Operating and Service Guide 1 Getting Started Introduction 2 Power Sensor Overview 3 Principles of Operation 6 The U2000 Series USB Power Sensors in Detail 9 Initial Inspection 11 Hardware Installation and Configuration 12 Checking the Power Sensor Firmware 19 This chapter introduces the Agilent U2000 Series USB power sensors with detailed information on the principles of operation, initial inspection, hardware installation and configuration, and a brief introduction
1 Getting Started Introduction The Agilent U2000 Series USB power sensors are standalone power sensors used for measuring the average power of continuous wave (CW) and modulated signals in 9 GHz to 24 GHz frequency range and –60 dBm to +44 dBm power range. The power sensors provide an easy plug- and- play USB connectivity to a PC or laptop, thus eliminating the need for a separate conventional power meter. The power sensors also compatible with some selected USB- based instruments from Agilent.
Getting Started 1 Power Sensor Overview 2 4 3 1 5 6 7 No. Part Functions 1 RF input port Allows RF/microwave input signal 2 LED indicator Indicates the states of the power sensor. Refer to “LED Indicator Guide” for more information.
1 Getting Started LED Indicator Guide The LED indicator is found at the rear panel of the power sensor. The following table shows the states of the LED indicator and its description. Table 1-1 States of LED indicator and its description LED indicator Description GREEN blinking Device in communication mode. Example: Sending SCPI commands or reading data. RED blinking Error - Highest priority event The error is due to HW/OS/Self-test. All other LED indicators will not function while having this error.
Getting Started 1 Power Up USB Enumeration GREEN Blinking HW/OS Error RED Blinking Self-test fail Self-test GREEN Blinking RED Blinking Internal Zeroing Default AMBER Read OFF Figure 1-1 LED indicator sequence during power-up U2000 Series Operating and Service Guide 5
1 Getting Started Principles of Operation The U2000 Series USB power sensors function as a power meter and power sensor in one device. The power sensor has the capability of sensing the signal, acquiring the data and signal conditioning, processing the data, and fulfilling communication function as in other Agilent test instruments. The low power measurement path is a 2- diode stacks and the high power path contains 5- diode stacks which extend the dynamic range square- law detection.
Getting Started 1 Sensor control and processing is provided by an embedded processor with Digital Signal Processing (DSP) capability which is supported by a 64 MB SDRAM. The available processing power enables the implementation of correction algorithm such as linearity correction, calibration factor, temperature compensation algorithm and internal zeroing algorithm. The correction factors for the sensors are stored in a 3 MB Flash memory.
Figure 1-2 Block diagram of the RF/microwave USB power sensor 1 8 Getting Started U2000 Series Operating and Service Guide
Getting Started 1 The U2000 Series USB Power Sensors in Detail Most of the power sensors used for measuring average power employ either thermocouple or diode technology. Diode- based sensors frequently rely on the application of correction factors to extend their dynamic range beyond their square law response region, typically from –70 dBm to –20 dBm. While this technique achieves a wide dynamic range capability, however, it is limited to continuous wave (CW) signals outside the square law region.
1 Getting Started This technique will ensure the diodes in the selected signal path are kept in their square law region, thus the output current (and voltage) is proportional to the input power. The diode pair/attenuator/diode pair assembly can yield the average of complex modulation formats across a wide dynamic range, irrespective of the signal bandwidth.
Getting Started 1 Initial Inspection Inspect the shipping container for damages. If the shipping container or packaging material is damaged, it should be kept until the contents of the shipment have been checked mechanically and electrically. If there is any mechanical damage, notify the nearest Agilent Technologies office. Keep the damaged shipping materials (if any) for inspection by the carrier and a Agilent Technologies representative.
1 Getting Started Hardware Installation and Configuration System Requirements Prior to using the U2000 Series USB power sensors, please ensure that the following minimum requirements are met: • PC or any device that has USB host capability • Agilent IO Libraries Suite 15.5 or higher had been installed. Users are encouraged to obtain the latest version of Agilent Libraries Suite for better performance.
Getting Started 1 Installing Your U2000 Series USB Power Sensor U2000 Series offers USB plug- and- play capability, with the proficiency of power meter and power sensor in a unit that enables users to obtain measurement readings via N1918A Power Analysis Manager. Follow the instructions below to install and configure the U2000 Series. 1 Connect your U2000 Series USB power sensor to the PC using the USB cable provided.
1 Getting Started Figure 1-5 Found New Hardware Wizard driver installation 5 A warning message will appear in the Hardware Installation window, as shown below. Click Continue Anyway to proceed with the installation of the driver. Figure 1-6 Hardware installation warning message NOTE 14 If you do not wish to receive similar warning message in future, follow the instructions below. 1 Go to Start > Control Panel and double-click System.
Getting Started 1 6 Click Finish when the installation has completed. Figure 1-7 Completing hardware driver installations 7 Once the driver installation has completed, the Assign USB device alias window may appear as shown below. Each time a USB device is plugged in, this dialog will be shown. To configure or disable this dialog, select an options in the Show this dialog panel and click OK.
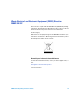
1 Getting Started Verifying Your Connected Power Sensor 1 To verify your connected power sensor, go to Start > All Programs > Agilent IO Libraries Suite > Agilent Connection Expert to launch Agilent Connection Expert. 2 Your connected power sensor will be detected and shown on the Instrument I/O on this PC panel as shown in the following figure.
Getting Started 1 4 To verify your connected power sensor, send the default SCPI command *IDN? to the power sensor by clicking Send & Read. The device’s response will appear in the Instrument Session History panel as shown in the following figure. Figure 1-11 Identification of your connected power sensor displayed 5 This verify that your U2000 Series USB power sensor has been connected and properly installed on your PC.
1 Getting Started Configuring Your Power Sensor via Power Analysis Manager 1 Go to Start > All Programs > Agilent N1918A Power Analysis Manager > Advance > Power Analyzer to launch your Power Analysis Manager. 2 With your power sensor still connected, a pop- up reminder dialog will appear when you launch the Power Analysis Manager. The reminder message will appear under two conditions: a You have not set any calibration due date for your U2000 Series.
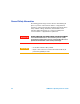
Getting Started 1 Checking the Power Sensor Firmware There are two ways that can be used to check the firmware revision of the power sensor: Agilent IO Libraries Suite 15.5 By using the Agilent IO Libraries Suite version 15.5 or higher, you can check the model code, serial number, firmware revision, and USB address. The VISA address is the USB address (see below).
1 Getting Started Agilent N1918A Power Analysis Manager By using the N1918A Power Analysis Manager, you can check the description, firmware revision, model number, resource ID and serial number as shown below: Figure 1-13 Power Analysis Manager Instrument Properties panel It is advisable to set the calibration due date. Refer to page 18 for more details.
Agilent U2000 Series USB Power Sensors Operating and Service Guide 2 Operating Information Measurement Mode 22 Power Sensor Configuration Settings 25 Measurement Accuracy and Speed 27 Internal and External Zeroing 30 Power Sweep and Frequency Sweep 32 Step Detection 33 Pulse Power Measurement in Average only Mode 34 This chapter describes some general operating information of the U2000 Series USB power sensors.
2 Operating Information Measurement Mode The U2000 Series USB power sensors have two measurement modes: average only (chopper- based measurement) and normal1 (sample- based measurement) mode. Average only Mode The average only mode (default mode) is optimized for wide dynamic range. In this measurement mode, a trigger can be controlled externally via TTL input.
Operating Information 2 Figure 2-1 Example of trace graph display for GSM signal U2000 Series Operating and Service Guide 23
2 Operating Information Measurement Gate A gate, controlled by and referenced to a trigger point, is used to extract measurement data from the captured trace. You can measure the gated average power of pulsed signals with the gate setup as shown in Figure 2- 2 on page 24.
Operating Information 2 Power Sensor Configuration Settings The auto- averaging settings shown in Figure 2- 3 are automatically configured when the U2000 Series USB power sensors are connected. NOTE Averaging settings can also be manually configured. In Figure 2- 3, the dotted- line arrow indicates the internal range based on the internal circuitry of the power sensor. The ranges will be automatically selected in correspondence with the power level to best fit the operating conditions and settings.
Operating Information Expected Power Low Power Path Sensor Dynamic Range High Power Path U2000/1B U2000/1/2H Maximum Sensor Power U2000/1/2/4A Within a Range 30 dBm 20 dBm 25 dBm 15 dBm 20 dBm 10 dBm 44 dBm 25 dBm 15 dBm 35 dBm 15 dBm 5 dBm 26 dBm 6 dBm –4 dBm 28 dBm 8 dBm –2 dBm 24 dBm 4 dBm –6 dBm 22.5 dBm 2.5 dBm –7.5 dBm 23.5 dBm 3.5 dBm –6.
Operating Information 2 Measurement Accuracy and Speed With U2000 Series USB power sensors, the range can be set either automatically or manually. Use auto- ranging when you are not sure of the power level you are about to measure. The DC coupling of the U2004A USB power sensor input allows excellent low frequency coverage. However, the presence of any DC voltages mixed with the signal will have an adverse effect on the accuracy of the power measurement, see on Page 51.
2 Operating Information The default is “AUTO”. In AUTO the range crossover value depends on the sensor model being used (see Table 2- 2). Table 2-2 Range Crossover Values Sensor Range Crossover Values U2000A, U2001A, U2002A, U2004A –7 dBm + 1 dB U2000H, U2001H, U2002H +3 dBm + 1 dB U2000B, U2001B +23 dBm + 1 dB Measurement Considerations While auto- ranging is a good starting point, it is not ideal for all measurements.
Operating Information 2 measurement of this signal. However, range holding in “UPPER” (the high power path), for a more accurate measurement, results in a considerably increased number of filtering processes. Speed and Averaging The same signal also requires a specific consideration of the measurement speed. As shown above, in auto- ranging mode, the U2000/1/4A sensor determines the average power level is below –7 dBm and selects the low power path.
2 Operating Information Internal and External Zeroing Zeroing a power sensor is performed in order to reduce zero measurement offset and noise impact to improve the accuracy of RF power measurement. The U2000 Series USB power sensors have two types of zeroing; internal zeroing and external zeroing. Internal zeroing is a new type of zeroing process whereby RF/Microwave power can be left connected to the sensor while it is being zeroed.
Operating Information 2 Figure 2-4 Select either INT or EXT from the Zero Type option U2000 Series Operating and Service Guide 31
2 Operating Information Power Sweep and Frequency Sweep The frequency sweep and power sweep features provide measurement automation between the U2000 Series USB power sensor and the signal source. This feature reduces the communication path and improves test time by eliminating the need of PC- instrument communication. To perform frequency sweep operation, users are required to set the start frequency, stop frequency and number of step for the signal source. By default, the step value is set to 0.
Operating Information 2 Step Detection To reduce the filter settling time after a significant step in the measured power, the filter can be set to re- initialize upon detection of a step increase or decrease in the measured power. Step detection can be set in both manual and automatic filter modes. Refer to the U2000 Series Programming Guide for more details on how to enable or disable the step detection.
2 Operating Information Pulse Power Measurement in Average only Mode The U2000 Series USB power sensors provide capability of performing average power measurements of pulsed signals in average only mode with the signal profile as shown below: • Pulse width ≥30 µs • Pulse period ≤8 ms • Duty cycle ≥1% To perform accurate average power measurements of pulsed signals, preset the sensor to Burst mode or using “SYSTem:PRESet BURST” SCPI command.
Agilent U2000 Series USB Power Sensors Operating and Service Guide 3 Specifications and Characteristics Introduction 36 Specifications 38 General Characteristics 67 This chapter describes the specifications and characteristics of your U2000 Series USB power sensors.
3 Specifications and Characteristics Introduction U2000 Series USB power sensors are average, wide dynamic range power sensors that can be used with a PC or some selected USB- based instruments from Agilent.
Specifications and Characteristics 3 Specification definitions There are two types of product specifications: • Warranted specifications • Characteristic specifications Warranted specifications Warranted specifications are covered by the product warranty and apply over 0 °C to 55 °C, unless otherwise noted. Warranted specifications include measurement uncertainty calculated with a 95% confidence level. Characteristic specifications Characteristic specifications are not warranted.
3 Specifications and Characteristics Specifications Frequency and Power Ranges Model Frequency Range U2000A 10 MHz to 18.0 GHz U2001A 10 MHz to 6.0 GHz U2002A 50 MHz to 24 GHz U2004A 9 kHz to 6.0 GHz U2000H 10 MHz to 18 GHz U2001H 10 MHz to 6 GHz U2002H 50 MHz to 24 GHz U2000B 10 MHz to 18 GHz U2001B 10 MHz to 6 GHz Power Range –60 dBm to +20 dBm –50 dBm to +30 dBm –30 dBm to +44 dBm Connector Type Model 38 Connector Type Impedance U2000/1/4A N-Type (m) 50 Ω U2002A 3.
Specifications and Characteristics 3 Maximum SWR (25 °C ±10 °C) Model Frequency SWR 10 MHz to 30 MHz 1.15 30 MHz to 2 GHz 1.13 2 GHz to 14 GHz 1.19 14 GHz to 16 GHz 1.22 16 GHz to 18 GHz 1.26 10 MHz to 30 MHz 1.15 30 MHz to 2 GHz 1.13 2 GHz to 6 GHz 1.19 50 MHz to 2 GHz 1.13 2 GHz to 14 GHz 1.19 14 GHz to 16 GHz 1.22 16 GHz to 18 GHz 1.26 18 GHz to 24 GHz 1.30 9 kHz to 2 GHz 1.13 2 GHz to 6 GHz 1.19 10 MHz to 2 GHz 1.12 2 GHz to 12.4 GHz 1.17 12.4 GHz to 18 GHz 1.
3 Specifications and Characteristics U2001H 10 MHz to 6 GHz 1.15 50 MHz to 8 GHz 1.15 8 GHz to 12.4 GHz 1.25 12.4 GHz to 18 GHz 1.28 18 GHz to 24 GHz 1.
Specifications and Characteristics 3 Figure 3-2 U2001A Typical SWR (25 °C ±10 °C) Figure 3-3 U2002A Typical SWR (25 °C ±10 °C) U2000 Series Operating and Service Guide 41
3 Specifications and Characteristics Figure 3-4 U2004A Typical SWR (25 °C ±10 °C) Figure 3-5 U2000H Typical SWR (25 °C ±10 °C) 42 U2000 Series Operating and Service Guide
Specifications and Characteristics 3 Figure 3-6 U2001H Typical SWR (25 °C ±10 °C) Figure 3-7 U2002H Typical SWR (25 °C ±10 °C) U2000 Series Operating and Service Guide 43
3 Specifications and Characteristics Figure 3-8 U2000B typical SWR (25 °C ±10 °C) Figure 3-9 U2001B typical SWR (25 °C ±10 °C) 44 U2000 Series Operating and Service Guide
Specifications and Characteristics 3 Maximum SWR (0 °C to 55 °C) Model Frequency SWR 10 MHz to 30 MHz 1.21 30 MHz to 2 GHz 1.15 2 GHz to 14 GHz 1.20 14 GHz to 16 GHz 1.23 16 GHz to 18 GHz 1.27 10 MHz to 30 MHz 1.21 30 MHz to 2 GHz 1.15 2 GHz to 6 GHz 1.20 50 MHz to 2 GHz 1.15 2 GHz to 14 GHz 1.20 14 GHz to 16 GHz 1.23 16 GHz to 18 GHz 1.27 18 GHz to 24 GHz 1.30 9 kHz to 2 GHz 1.15 2 GHz to 6 GHz 1.20 10 MHz to 2 GHz 1.14 2 GHz to 12.4 GHz 1.18 12.4 GHz to 18 GHz 1.
3 Specifications and Characteristics U2000H U2001H 10 MHz to 8 GHz 1.17 8 GHz to 12.4 GHz 1.26 12.4 GHz to 18 GHz 1.29 10 MHz to 6 GHz 1.17 50 MHz to 8 GHz 1.17 8 GHz to 12.4 GHz 1.26 12.4 GHz to 18 GHz 1.29 18 GHz to 24 GHz 1.
Specifications and Characteristics 3 Maximum Power Models Maximum Power U2000/1/2A +25 dBm (320 mW) average, 20 VDC +33 dBm (2 W) peak, <10 μs U20004A +25 dBm (320 mW) average, 5 VDC +33 dBm (2 W) peak, <10 μs U2000/1H +33 dBm (2 W) average, 20 VDC +50 dBm (100 W) peak for 1 μs U2002H +33 dBm (2 W) average, 10 VDC +50 dBm (100 W) peak for 1 μs U2000/1B +45 dBm (30 W) average, 20 VDC +47 dBm (50 W) peak for 1 μs CAUTION The U2004A USB power sensor is DC coupled.
3 Specifications and Characteristics Power Accuracy This specification is valid only after zeroing and calibration of the power sensor at ambient environmental conditions. Table 3-1 Average only Mode Power Accuracy1 (with exclusions) Model Power Level Accuracy 25 °C ±10 °C Accuracy 0 °C to 55 °C U2000/1/2/4A –60 dBm to +20 dBm ±3.0% ±3.5% U2000/1/2H –50 dBm to +30 dBm ±4.0% ±5.0% U2000/1B –30 dBm to +44 dBm ±3.5% ±4.
Specifications and Characteristics 3 Power Accuracy Plots (Average only Mode) Figure 3-10 Typical power accuracy at 25 °C for U2000/1/2/4A models1, 2 Figure 3-11 Typical power accuracy at 25 °C for U2000/1B models1, 2 U2000 Series Operating and Service Guide 49
3 Specifications and Characteristics Figure 3-12 Typical power accuracy at 25 °C for U2000/1/2H models1, 2 1 Measurement uncertainty ≤1.9%. At room temperature and excluding power level dependent terms (zero set, drift, and noise). Refer to Agilent Fundamentals of RF and Microwave Power Measurements (Part 3) Power Measurement Uncertainty per International Guide (Application Note 1449-3), 5988-9215EN for more information on measurement uncertainty.
Specifications and Characteristics 3 Switching Point The U2000 Series USB power sensors have two measurement paths: a low power path and a high power path as shown in Table 3- 3.
3 Specifications and Characteristics Examples U2000/1/2/4A Power Sensors The switching point for U2000/1/2/4A sensor is –7 dBm. The hysteresis causes the low power path to remain selected until approximately –6.5 dBm has been reached. As the power level increases above –6.5 dBm, the high power path will be selected. The high power path remains selected until approximately –7.5 dBm has been reached. As the power level decreases below –7.5 dBm, the low power path will be selected.
Specifications and Characteristics 3 Zero Set, Zero Drift, and Measurement Noise Average only Mode For U2000/1/2A, Range1 Zero Set (Internal) Zero Set (External) Zero Drift2 Measurement Noise3 –60 dBm to –35 dBm ±1.5 nW ±600 pW 200 pW 1 nW –38 dBm to –15 dBm ±2 nW ±1.5 nW 400 pW 1.5 nW –20 dBm to –6.5 dBm ±12 nW ±10 nW 1.5 nW 15 nW –7.
3 Specifications and Characteristics For U2000/1B, Measurement Noise3 Range1 Zero Set (Internal) Zero Set (External) Zero Drift2 –30 dBm to –5 dBm ±1.8 µW ±800 nW 200 nW 1 µW –8 dBm to 15 dBm ±2 µW ±2 µW 400 nW 1.5 µW 10 dBm to 23.5 dBm ±12 µW ±10 µW 1.5 µW 15 µW 22.5 dBm to 28 dBm ±2 mW ±1 mW 50 nW 650 µW 26 dBm to 44 dBm ±4 mW ±2 mW 500 µW 1 mW 1 Condition: (i) 0 °C to 55 °C and (ii) 40 °C, 95% relative humidity.
Specifications and Characteristics 3 Effects of Averaging on Average only Mode Measurement Noise Averaging over 1 to 1024 readings is available for reducing noise. The previous tables provide the measurement noise for a particular sensor. Use the noise multiplier in Table 3- 4 for the appropriate speed (Normal or x2), and the number of averages to determine the total measurement noise value.
3 Specifications and Characteristics Normal Mode For U2000/1/2A, Range1 Zero Set (Internal) Zero Set (External) Zero Drift2 Measurement Noise3 Noise Per Sample4 –38 dBm to –15 dBm 47 nW 43 nW 25 nW 28 nW 90 nW –20 dBm to –6.5 dBm 530 nW 480 nW 230 nW 300 nW 1 µW –7.
Specifications and Characteristics 3 For U2000/1B, Range1 Zero Set (Internal) Zero Set (External) Zero Drift2 Measurement Noise3 Noise Per Sample4 –8 dBm to 15 dBm 47 µW 43 µW 25 µW 28 µW 90 µW 10 dBm to 23.5 dBm 530 µW 480 µW 230 µW 300 µW 1 mW 22.5 dBm to 28 dBm 30 mW 27 mW 19 mW 20 mW 55 mW 26 dBm to 44 dBm 32 mW 34 mW 24 mW 21 mW 85 mW 1 Condition: (i) 0 °C to 55 °C and (ii) 40 °C, 95% relative humidity.
3 Specifications and Characteristics Example: U2000A power sensor, measured power = –4 dBm, gate length = 1.36 ms, number of averages = 256. The measured power is –4 dBm, thus the corresponding noise per sample is 85 µW (refer to the noise per sample table). Use Equation 2 for measurement noise calculation: 1 4 85µW × ------------- × 4 ⎛ -------------------------------------------------⎞ = 1.123µW ⎝ ( 1.36 ms ) ⁄ ( 0.68µs )⎠ 256 The calculated measurement noise (1.
Specifications and Characteristics 3 Settling time In FAST mode (using Free Run trigger), for a 10 dB decreasing power step, the settling time is: Time U2000 Series USB Power Sensors 25 ms1 1 When a power step crosses the auto-range switch point of the sensor, add 25 ms. For Normal and x2 speed, manual filter, and a 10 dB decreasing power step (not across the switching point), refer to Table 3- 5.
3 Specifications and Characteristics For auto filter, default resolution, and a 10 dB decreasing power step (not across the switching point), refer to Figure 3- 13. X2 Speed Typical Settling Times Maximum sensor power within a range Normal U2000/1/2/4A Speed 45 ms 45 ms 82 ms 90 ms 1.3 s 2.6 s 1.5 s 2.7 s 450 ms 2.
Specifications and Characteristics 3 Calibration Factor and Reflection Coefficient The Calibration Factor (CF) corrects the frequency response of the sensor. The Reflection Coefficient (Rho, or ρ) relates to the SWR based on the following formula: 1+ρ SWR = -----------1–ρ Typical uncertainties of the CF data are listed in the following tables.
3 Specifications and Characteristics Cal Factor Uncertainty U2000A Frequency Typical CF Uncertainty (25 °C ±10 °C) 10 MHz to 30 MHz 1.8% 30 MHz to 2 GHz 1.6% 2 GHz to 14 GHz 2.0% 14 GHz to 16 GHz 2.2% 16 GHz to 18 GHz 2.2% U2001A Frequency Typical CF Uncertainty (25 °C ±10 °C) 10 MHz to 30 MHz 1.8% 30 MHz to 2 GHz 1.6% 2 GHz to 6 GHz 2.0% U2002A Frequency Typical CF Uncertainty (25 °C ±10 °C) 62 50 MHz to 2 GHz 2.0% 2 GHz to 14 GHz 2.5% 14 GHz to 16 GHz 2.7% 16 GHz to 18 GHz 2.
Specifications and Characteristics Frequency 3 U2004A Typical CF Uncertainty (25 °C ±10 °C) 9 kHz to 2 GHz 1.8% 2 GHz to 6 GHz 1.8% U2000B Frequency Typical CF Uncertainty (25 °C ±10 °C) 10 MHz to 2 GHz 1.8% 2 GHz to 12.4 GHz 2.0% 12.4 GHz to 18 GHz 2.2% U2001B Frequency Typical CF Uncertainty (25 °C ±10 °C) 10 MHz to 2 GHz 1.8% 2 GHz to 6 GHz 2.0% U2000H Frequency Typical CF Uncertainty (25 °C ±10 °C) 10 MHz to 8 GHz 2.0% 8 GHz to 12.4 GHz 2.0% 12.4 GHz to 18 GHz 2.
3 Specifications and Characteristics U2001H Frequency Typical CF Uncertainty (25 °C ±10 °C) 10 MHz to 6 GHz 2.0% U2002H Frequency Typical CF Uncertainty (25 °C ±10 °C) 64 50 MHz to 8 GHz 2.5% 8 GHz to 12.4 GHz 2.5% 12.4 GHz to 18 GHz 2.7% 18 GHz to 24 GHz 3.
Specifications and Characteristics 3 Trigger Internal Trigger Resolution 0.1 dB Level accuracy ± 1 dB Jitter ± 1 µs External TTL Trigger Input Impedance 50 Ω or 1 kΩ Trigger low <1.1 V Trigger high >1.9 V Minimum trigger pulse width 35 ns Minimum trigger repetition period 80 ns Trigger latency 11 µs ±2 µs Trigger Delay Range –0.15 s to +0.15 s Resolution 1 µs Trigger hold-off Range 1 µs to 400 ms Resolution 1 µs Trigger Hysteresis Range 0 dB to +3 dB Resolution 0.
3 Specifications and Characteristics Normal Mode Key Specifications and Characteristics Parameters1 Performance Maximum video bandwidth 40 kHz Minimum rise time 40 µs Minimum fall time 40 µs Range settling time 150 µs Minimum pulse width 200 µs Sampling rate 1.
Specifications and Characteristics 3 General Characteristics Physical Characteristics Net Weight U2000/1/4A 0.262 kg U2002A 0.226 kg U2000/1B 0.762 kg U2000/1H 0.324 kg U2002H 0.274 kg Dimensions (L x W x H) U2000/1/4A 163.75 mm x 46.00 mm x 35.90 mm U2002A 134.37 mm x 46.00 mm x 35.90 mm U2000/1B 308.00 mm x 115.00 mm x 84.00 mm U2000/1H 207.00 mm x 46.00 mm x 36.00 mm U2002H 164.00 mm x 46.00 mm x 36.
3 68 Specifications and Characteristics U2000 Series Operating and Service Guide
Agilent U2000 Series USB Power Sensors Operating and Service Guide 4 Service General Information 70 Performance Test 71 Replaceable Parts 74 Service 76 Troubleshooting 76 This chapter describes the performance test and provides information on replaceable parts as well as on service details.
4 Service General Information This chapter contains information about general maintenance, performance tests, troubleshooting and the repair of U2000 Series USB power sensors. Cleaning Use a clean, damp cloth to clean the body of the U2000 Series USB power sensors. Connector Cleaning CAUTION The RF connector beads deteriorate when contacted with hydrocarbon compounds such as acetone, trichloroethylene, carbon tetrachloride, and benzene. CAUTION Clean the connector only at a static free workstation.
Service 4 Performance Test Standing Wave Ratio (SWR) and Reflection Coefficient (Rho) Performance Test This section does not establish preset SWR test procedures since there are several test methods and different equipment available for testing the SWR or reflection coefficient. Therefore, the actual accuracy of the test equipment must be accounted for when measuring against instrument specifications to determine a pass or fail condition.
4 Service Table 4-3 Power Sensor SWR and Reflection Coefficient for the U2002A Frequency CAUTION Actual Measurement Maximum Rho SWR 50 MHz to 2 GHz 0.061 1.13 2 GHz to 14 GHz 0.087 1.19 14 GHz to 16 GHz 0.099 1.22 16 GHz to 18 GHz 0.115 1.26 18 GHz to 24 GHz 0.130 1.30 DC voltages in excess of the maximum value (5 VDC) can damage the sensing diode. Table 4-4 Power Sensor SWR and Reflection Coefficient for the U2004A Frequency Actual Measurement Maximum Rho SWR 9 kHz to 2 GHz 0.
Service 4 Table 4-6 Power Sensor SWR and Reflection Coefficient for the U2001H Frequency Actual Measurement 10 MHz to 6 GHz Maximum Rho SWR 0.070 1.15 Table 4-7 Power Sensor SWR and Reflection Coefficient for the U2002H Frequency Actual Measurement Maximum Rho SWR 50 MHz to 8 GHz 0.070 1.15 8 GHz to 12.4 GHz 0.111 1.25 12.4 GHz to 18 GHz 0.123 1.28 18 GHz to 24 GHz 0.130 1.
4 Service Replaceable Parts Table 4- 10 contains a list of replaceable parts. To order a part, quote the Agilent part number, specify the quantity required, and address the order to the nearest Agilent office. NOTE 74 Within the USA, it is better to order directly from the Agilent Parts Center in Roseville, California. Ask your nearest Agilent office for information and forms for the “Direct Mail Order System.
Service 4 Table 4-10 Replaceable Parts Model U2000A U2001A U2002A U2004A U2000B U2001B U2000H U2001H U2002H All models U2000 Series Operating and Service Guide Agilent Part Number Qty U2000-60006 1 U2000A replacement module 5190-0062 1 Top label for U2000A U2001-60006 1 U2001A replacement module 5190-0650 1 Top label for U2001A U2002-60006 1 U2002A replacement module 5190-0651 1 Top label for U2002A U2004-60006 1 U2004A replacement module 5190-0652 1 Top label for U2004A U200
4 Service Service The following service instructions consist of information on troubleshooting, and repairs. Troubleshooting The U2000 Series USB power sensors represent a combination of a power meter and power sensor in one unit. If the LED is red and blinking, it indicates that there is a hardware error or operating system (OS) error in the power sensor. The LED will only be blinking red if the power sensor failed in the self- test.
Service 4 Disassembly and Reassembly Procedure Disassembly Procedure Disassemble the power sensor by performing the following steps: CAUTION Disassemble the power sensor only in a static free workstation. Electrostatic discharge renders the power sensor inoperative. Table 4-11 Disassembly Procedure 1 Remove the top label. 2 Loosen three screws by using M2 to remove the housing. 3 Replace the defective sensor module with a new sensor module. Please refer to Table 4- 10.
4 Service Reassembly Procedure Tools required for reassembly: Tools M2 Torx Purpose To fit the housing Qty 1 Torque value 3.98 lbs.in Reassembly instructions: The reassembly procedures are simply the reversal of the disassembly procedure.
Service 4 Attenuator Disassembly and Reassembly Procedure for U2000B and U2001B Disassembly Procedure Tools required for disassembly: Tools NOTE Purpose Torque value ¾” torque wrench To loosen the attenuator 80 lbs.in ½” wrench To prevent rotation N/A The attenuator for U2000B and U2001B must not be disassembled under any circumstances except during annual calibration. Removing the attenuator for U2000B and U2001B will void the calibration.
4 Service Reassembly Procedure Tools required for reassembly: Tools Purpose Torque value Loctite Threadlocker 242 To secure the connection between the attenuator and the sensor’s connector N/A ¾” torque wrench To tighten the attenuator 12 lbs.in Table 4-13 Attenuator Reassembly Procedure 1 Apply one drop of loctite on the first, second, and third threads of the connector. 2 Tighten the connector using the torque wrench.
Agilent U2000 USB Power Sensors Operating and Service Guide Appendix Appendix A: Zero Set, Zero Drift, and Measurement Noise 82 Agilent Technologies 81
Appendix Appendix A: Zero Set, Zero Drift, and Measurement Noise The following specifications in Table 5- 1 are only applicable to the U2000 Series USB power sensors with the serial prefix as shown below: Model Serial Prefix U2000A Serial Prefix MY470/SG470 and below U2001A Serial Prefix MY471/SG471 and below U2002A Serial Prefix MY472/SG472 and below U2004A Serial Prefix MY474/SG474 and below Table 5-1 Zero Set, Zero Drift, and Measurement Noise for Average only Mode Range1 Zero Set Zero Drif
www.agilent.