
Installation guide

7
How Does It Work? (continued)
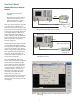
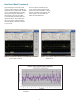
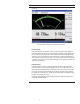
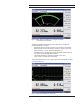
Figure 11 and Figure 12 show the
measurement result of “locked” and
“drifted” LO signal by FOM mode (see
the blue trace) and USB power sensor
(see the red trace) respectively. The
measurement result of the USB power
sensor shows that it has good correlation
with the FOM result at locked signal, and
is stable with drifted LO signal.
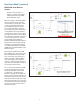
For details of the frequency offset
procedure and operation of VBA with
the USB power sensor, please refer to
the “Agilent Simple Scalar Network
Analysis of Frequency Converter Devices
using U2000 USB Power Sensor Series
with ENA Series Network Analyzers,
Application Note”
Figure 12 Measurement results with “Drifted” LO (RF Power versus IF Power)
Figure 11 Measurement results with “Locked” LO (RF Power versus IF Power)