
Installation guide

5
How Does It Work? (continued)
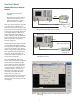
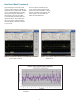
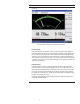
Figure 6 and Figure 7 show the results
of source power calibration for EPM and
USB power sensors respectively. The PNA
source is stepped through the specifi ed
range (in this example, stepped from 1
GHz to 6 GHz), and power (at 0 dBm)
is measured with the power meter and
USB power sensor. At each data point,
the source power is adjusted until the
measured power is within the specifi ed
accuracy level.
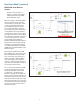
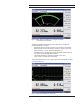
The source power calibration results
can be saved in a Microsoft® Excel fi le
and the two results combined in a single
graph for comparison (see Figure 8). The
results appear to be comparable and
within the ±0.05 db limit line.
Figure 6 Source power calibration result with EPM and E9301A
power meter and sensor
Figure 7 Source power calibration result with U2000 Series USB
power sensor
Figure 8 EPM power meter and USB power sensor source power calibration data
comparison