
Technical data

Data Logging/Virtual Meter
Agilent GUI Data Logger Quick Start Guide 11
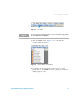
Figure 14 Secondary
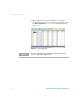
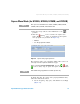
7 Click the Shows menu (Figure 15) to customize the
column display preference.
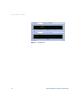
Figure 15 Column display customization
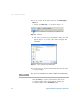
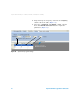
8 To display the measured data in the form of a strip
graph, click on the Graphs tab. These graphs are meant for
display purposes only.
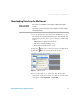
NOTE
You can change the maximum number of records in the Data Logging Table
by clicking Preferences > Options.