
Specifications


11
Page 21
安捷倫科技高頻元件量測研討會
Feb.23, 2006
Agilent Ptolemy - The “IP Integrator”
ADS Ptolemy is a solution for the following:
• Design & verification of Communication Systems
(physical path).
• Co-Simulation of Baseband (DSP) and Analog/RF (A/RF)
circuits in a single simulation:
Ptolemy system with ADS circuit simulators (which
can also contain Verilog-A models).
Ptolemy system with 3
rd
party tools (Matlab, RTL-HDL
simulators, C++, SystemC)
• ”Connected Solutions” connect Simulation, Design &
Verification flows to Instrumentation and Measurements
• Circuit verification with System Test Benches (WTBs) to
link ADS and Cadence (IC) design tools.
Page 22
安捷倫科技高頻元件量測研討會
Feb.23, 2006
Link Level Simulation
Trace_Spacing sets the distance betwen line pairs
as a multiple of intrapair spacing.
This upsample sets
measurement resolution
Bi pol ar si gnal , +1, -1
The S ampleDelay of 3 will work for the
default design. If the Channel is changed
thi s del ay c an be se t vi a a sl ider in the T k
controller. Set the slider to the same delay
as the Eye delay sli der when the widest part
of t he eye i s at t =0 on the eye pl ot.
The S ample Del ay of 11 wi ll work for th e
defau lt de sign . If th e Ch annel is changed
this delay can be set via a slider in the Tk
cont roll er. S et th e sli der to the s ame dela y
as th e Ey e del ay sl id er when the wi des t part
of t he e ye i s a t t =0 on the ey e p lot .
For the hi st ograms to be cor rect
the pha se nee ds to be s et to the
corre ct bi t sl ic e sampl e del ay.
(11 will work for the default design).
For the histograms to be correct
the phase needs to be set to the
corre ct bi t sl ic e samp le del ay .
(3 will work for the default design).
Typi cal Pre -emphas is is prog rmapl e in s teps f rom 5% to 25%
This equates to 1.05 to 1.25 on this controller.
Add ing nois e or oth er artef acts to the
si gnal c an be do ne in this fashi on.
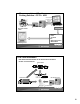
Channel Model
PTOLEMY-SPICE CO-SIM SI CHANNEL WITH TX PRE-EMPHASIS AND RX EQUALIZATION
(Usin g the "drive_li nes" channel example)
Post Eq measurements
Receiver wit h Eq ualization
Bit-st ream T ran smit ter
with Pre-em ph asis
Adding Noise
Post- channel measur ements
Post- channel
Inter active
Meas urements
Post Eq
Inter active
Meas urements
Pre-channel measur ements
Pre-channel
Inter active
Meas urements
1
2
Tk C o n s t e l la t io n
T20
Style=dot
SampleDelay=10
Amplitude=1.5
Nu mSa mpl es P erS y mbo l=S a mpl es _pe r_cl o ck
Label="Bit Slice"
1
2
Tk C o n s t e l la t io n
T18
Style=dot
SampleDelay=6
Amplitude=1.5
Nu mSa mpl es P erS y mbo l=S am pl es _per_ cl oc k
Label="Bit Slice Eq"
12
RateLimiter
R8
R Max=4 e10
12
drive_lines_cosim3_sub_s2p
X7
Trace_Spacing=3
IO
31
2
LMS_TkPlot
L4
Identifier="LMS fil ter taps"
Sa ve Taps Fil e="t aps out. tap "
ErrorDe lay=1
StepSize=0.02
De ci mat io nP has e=0
Decimation=1
Taps= "-2.3 0 0. 4 1.0 1. 3 1.3 1. 2 0.8 -0. 1 -0.8 -1. 6"
12
Float ToTi med
F3
TStep=Sample_step sec
12
Re peat
R5
BlockSize=1
NumTimes=Samples_per_clock
12
Logi cToN R Z
L5
Amp li t ude=1. 0
1
2
3
Add2
A2
1
TkSlider
Sc al e 1
Granularity=100
PutInControlPanel=YES
Identi fier="Pre-emphas is Gain"
Val u e =1
Hi g h = 2
Low=1
12
3
Pre-Emphasis
X6
3
21
1
2
3
SplitterRF
S2
1
Bits
B1
LFSR_InitState=1
LFS R _Len gth= 12
ProbOfZero=0.5
Type= Ran dom
1
Const
C2
Leve l =0.0
1
Tk H i st og r am
T19
DataPoints=10000
NumberOfBars=32
Bottom=-1.5
Top=1. 5
Label="Bit Slice Histogram Eq"
12
DownSample
D3
Phase=11
Fact or=S ampl es _p er_c l ock
1
Tk H i st og r am
T21
DataPoints=10000
NumberOfBars=32
Bottom=-1.5
Top=1. 5
Label="Bit Slice Histogram"
12
DownSample
D2
Phase=3
Fact or=S ampl es _p er_c l ock
1
Tk E y e
T14
Amp li t ude=1
NumSymbols=2
NumSamplesPerSymbol=Samples_per_clock
Label ="P re Chann el E ye"
1
SpectrumAnalyzer
Pr e_ch annel
Wi ndo wC ons ta nt= 0.0
Window=Kaiser 7.865
St op=Da ta_C oll ecti on_ time nsec
St art =De faul tTi meS t art
RLoad=D efaultRLoad
Pl ot =N one
1
Sp ec trumA n al yz er
Po st _c hann el
Wi nd owC on st ant =0.0
Wi ndow =Ka is er 7.865
St op=D ata_C oll ect ion _ti me nsec
Start=DefaultTimeStart
RL oad=D ef aul tR Lo ad
Pl ot =N one
1
Ti me d S i n k
Po st _E q_ t
ControlSimulation=YES
St op=D ata_C oll ect ion _ti me nsec
Start=DefaultTimeStart
RL oad=D ef aul tR Lo ad
Pl ot =N one
12
TimedToFloat
T22
12
1
R
R7
R=50 Ohm
2
1
R
R3
R=50 Ohm
1
Tk P l ot
T13
St yl e =conn ec t
yR ange="-2 2"
xR ange="0 10 00"
yTitle="amplitude"
xTitle="waveform"
Label ="P re Chan nel s cope "
1
Tk E y e
T5
Amplitude=1.5
NumSymbols=2
Nu mSa mpl es P erS y mbo l=S a mpl es _pe r_cl o ck
Label ="E ye P ost Chann el "
1
Ti me d S i n k
Pr e_ch anne l_ t
ControlSimulation=YES
St op=D ata_C oll ect ion_ tim e nsec
Start=DefaultTimeStart
RL oad=D ef aul tR Load
Pl ot =N one
12 31
2
Sub
S9
2
1
R
R6
R=50 Ohm
1
12
TimedToFloat
T12
1
TkPl ot
T7
Style=connect
yR ange="- 1 1"
xR ange="0 1 000"
yTitle="amplitude"
xTitle="waveform"
Label="Post Channel scope"
12
Dela y
D1
N=1
1
Const
C1
Level=0.0
1
Tk E y e
T17
Amplitude=1.5
NumSymbols=2
Nu mSa mpl es P erS y mbo l=S am pl es _per_ cl oc k
Label ="E ye E q"
1
2
3
SplitterRF
S7
1
Ti me d S i n k
Po st _c hann el_ t
ControlSimulation=YES
St op=D ata_C oll ect ion _ti me nsec
Start=DefaultTimeStart
RL oad=D ef aul tR Lo ad
Pl ot =N one
1
2
3
SplitterRF
S6
1
12
TimedToFloat
T6
1
2
3
SplitterRF
S8
1
2
3
SplitterRF
S4
DF
DF2
VAR
VAR1
Data_Collection_start=4
Data_Collection_time=40
Sample_step=1/Sample_rate
Sample_rate=Clock*S amples_per_clock
Samples_per_clock=12
Clock=12.8e9
Eqn
Var
1
2
3
Mpy2
M3
1
TkSlider
Scale2
Granularity =100
PutInControlPanel=YES
Iden tifier="Added Nois e"
Value=0
High =1
Low=0
12
FIR
F4
Interpolation=1
DecimationPhase=0
Decimation=1
1
IID_Gaussian
I1
Variance=.1
Mean=0
Pre-emphasis
Channel Equalization