
User manual


Appendix B General information on cdma2000 system B
N9360A Multi UE Tester CDMA2000 User Manual B-3
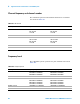
S/R frequency interval
S/R frequency interval is designed as shown in Table B-3.
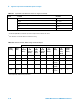
UE maximum transmission power
The maximum transmission power is defined as shown in
Table B-4 by the power class. The defined maximum
transmission power is the broadband transmission output of
UE. In other words, the output is the chip rate of at least (1+a)
band width times the radio access mode. The measuring period
is at least one time slot.
Reference:
Table B-3 S/R frequency interval
Radio System Up Frequency Down Frequency
BAND0: Cel US 815040000 + 30000 * (N-1024)
825000000 + 30000 * (N-1023)
825000000 + 30000 * N
860040000 + 30000 * (N-1024)
870000000 + 30000 * (N-1023)
870000000 + 30000 * N
BAND1: PCS US 1850000000 + 50000 * N 1930000000 + 50000 * N
BAND3:Cel: JP 887000000 + 12500 * (N-1040)
893000000 + 12500 * (N-1200)
898000000 + 12500 * (N-800)
915000000 + 12500 * N
832000000 + 12500 * (N-1040)
838000000 + 12500 * (N-1200)
843000000 + 12500 * (N-800)
860000000 + 12500 * N
BAND4: PCS KR 1750000000 + 50000 * N 1840000000 + 50000 * N
BAND6: IMT-2K 1920000000 + 50000 * N 2110000000 + 50000 * N
Table B-4 UE maximum transmission power
Operating band Power Class 1 Power Class 2 Power Class 3 Power Class 4 Power Class 5
Lower
Limit
(dBm)
Upper
Limit
(dB)
Lower
Limit
(dBm)
Upper
Limit
(dB)
Lower
Limit
(dBm)
Upper
Limit
(dB)
Lower
Limit
(dBm)
Upper
Limit
(dB)
Lower
Limit
(dBm)
Upper
Limit
(dB)
Band 0, III +31 +38 +27 +34 +23 +30 – – – –
Band I, IV, VI, XV+28+33+23+30+18+27+13+24 +8 +21
Band VI (In Japan)+20+24+20+24+18+24+13+24 +8 +21