
User`s guide

4 Making Measurements
68 N9340B User’s Guide
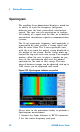
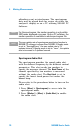
Spectrogram
The scrolling three- dimensional display is noted for
its ability to track the frequency and power
behavior over the time, particularly intermittent
signals. The user can use spectrogram to analyze
the stability of a signal over the time, or to identify
intermittent interference signals in communications
systems.
The X- axis represents frequency, and amplitude is
represented by color, red for a strong signal and
blue for noise floor. The Y- axis represents time,
with the trace from the newest sweep displayed at
the bottom of the screen. Earlier traces move up
toward the top with each new sweep. Two coupled
markers allow the user to place a marker on any
trace in the spectrogram and view the normal
spectrum for the time of that sweep. The time
interval between sweeps can be adjusted, and up to
1500 traces can be displayed and saved.
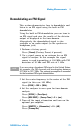
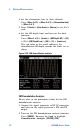
Figure 4-24 Spectrogram submenu screenshot
Please refer to the procedures below to perform a
Spectrogram measurement.
1 Connect the Omni Antenna to RF IN connector.
2 Set the center frequency and span.