
Technical data
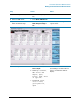
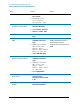
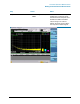
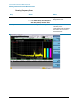
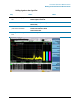
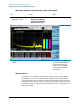
Table Of Contents
- EMC Measurement Application Measurement Guide
- Table of Contents
- 1 EMC Measurements
- 2 Conducted Emissions Measurements
- 3 Radiated Emissions Measurements
- A: Line Impedance Stabilization Networks (LISN)
- B: Antenna Factors
- C: Basic Electrical Relationships
- D: Detectors Used in EMI Measurements
- Glossary of Acronyms and Definitions
16
Conducted Emissions Measurements
Making Conducted Emission Measurements
Measuring the Quasi-peak and average values of the signals
Measurement tip
If the signals you are looking at are in the lower frequency range of the conducted
band, 2 MHz or lower, you can reduce the stop frequency to get a closer look. Note
that there are fewer points to view. You can add more data points using the scan table.
The default setting in the scan table is two data points per BW or 4.5 kHz per point. To
get more data points, change the points per bandwidth to 2.25 or 1.125 to give four or
eight points per BW.
Step Action Notes
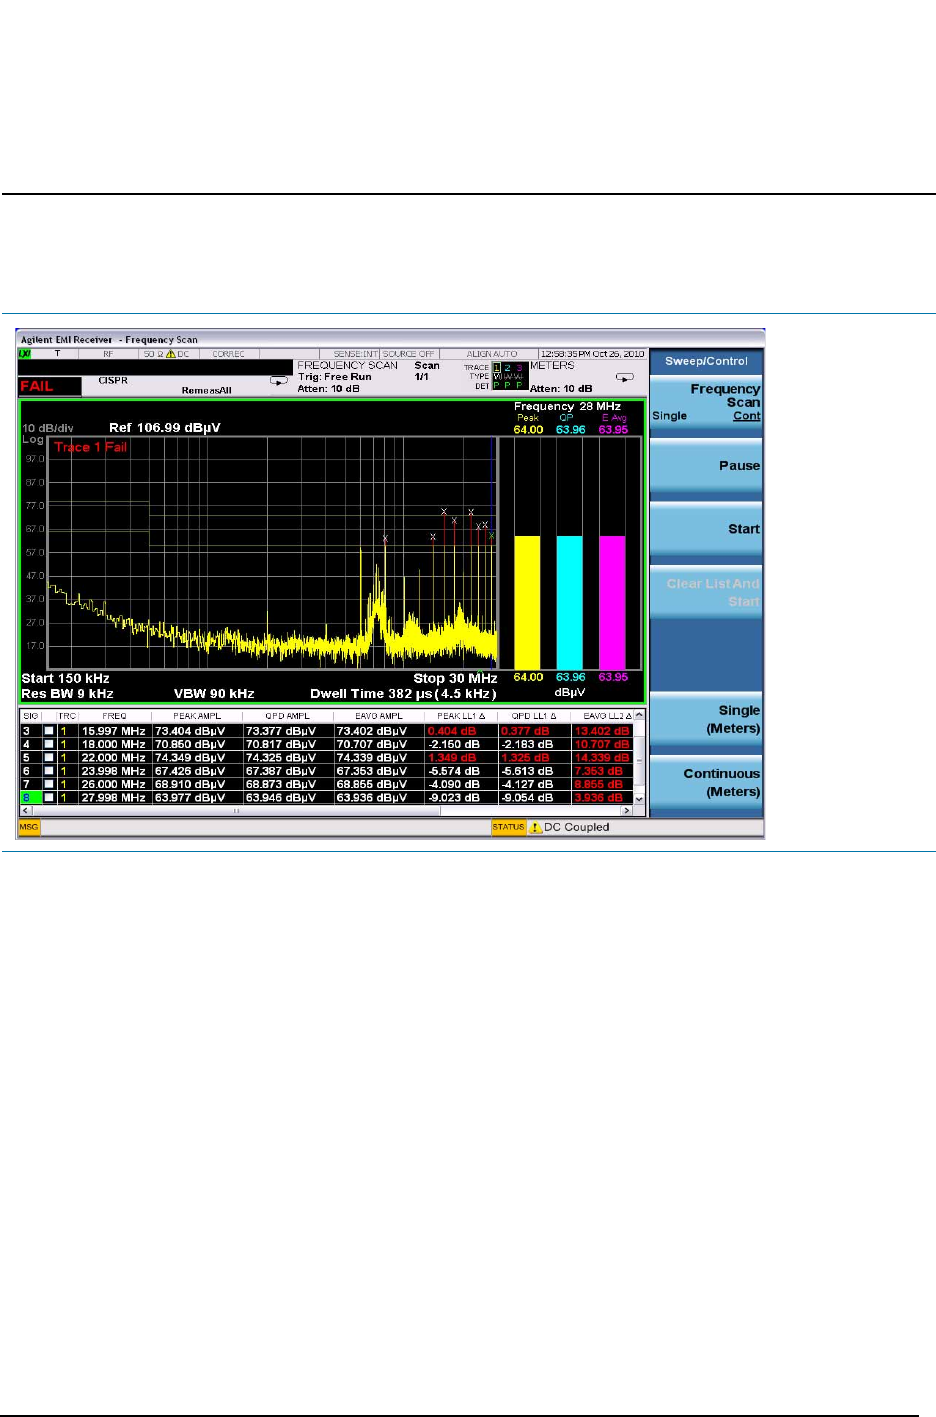
1 Perform a Re-measure on
all signals in the list
a. Press Meas Setup, Scan
Sequence, (Re)measure,
(Re)measure, All Signals,
Sweep/Control, Start.
2 Review the measurement
results
The delta to Limit Line values
should all be negative. If some
of the measurements are
positive, there is a problem
with conducted emissions
from the DUT.