
User`s guide


528 5967–9446
Graphs and Tables
Several NetMetrix applications use a graph tool or table tool to display
information. These tools provide many features for manipulating the
displayed data such that you can visualize the information in a way that
best suits your needs.
The chapters for the applications that use the graph and table tools
discussed here refer you to these pages as needed.
The graph tool is discussed below. Information on the table tool begins on
page 537.
Working with Graphs
The graph tool includes many configuration options that let you control
the data to display in the graph and the appearance of the graphs
themselves.
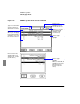
A sample graph is shown in figure 112 on page 529.
The following pages explain how to:
● Select which statistics to display (page 530).
● Choose the line colors and widths for the graph (page 530).
● Set a scale multiplier for each statistic (page 530).
● Change the display interval and data resolution (page 532).
● View a table of statistics being graphed (page 534).
● Tailor the graph’s appearance (page 535).
graph tool icon