
User`s guide


Protocol Analyzer
Working with Captured Packets
5967–9446 397
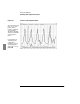
Example The following example configures four packet capture instances, one for
traffic to and from each of four file servers on a particular LAN segment.
Once the instances are configured and started, you can view the relative
traffic patterns for these systems on the same graph.
To configure the four packet capture instances, follow these steps:
1 Start Protocol Analyzer, SNMP-based, against an agent on the seg-
ment containing the four file servers.
2 Because the contents of the captured packets aren’t important for this
example, choose Settings➤Capture Buffer… Change the buffer size
to Kbytes: 0.
3 Choose Instance➤New…, and specify a name for the instance; for
example, use the first host name.
4 Choose Filter➤Host➤ToFrom…, add the first host name to the list,
and click Apply.
5 Click the base window’s START button to start the instance.
6 In the ToFrom filter window, remove the host name from step 4, then
repeat steps 3 – 6 for each of the remaining hosts.
You should now have four different packet capture instances running,
one for each of the four file servers.
Choose View➤Traffic Trend… An empty graph window appears. After
polling for a while, the graph will look similar to the one in figure 83 on
page 398.
See Also “Working with Graphs” on page 528.
“To configure the capture buffer” on page 356.