
User`s guide


Load Monitor
Displaying Load
278 5967–9446
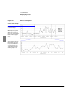
Figure 61 Effects of Expand
Lines indicate
selected range
With Expand, points
within the selected
range are expanded to
fill the visible graph
area
Same graph after an
Expand shows that
the points within the
selected range are
expanded to fill the
visible graph area
X Axis: Time Graph