
User`s guide


Load Monitor
Displaying Load
272 5967–9446
To view a Conversation segment graph
1 Select Conversation➤Properties➤Graph…
2 Change the Graph Type to Segment.
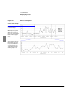
A useful way to view traffic between nodes is with Load Monitor’s conver-
sation segment graph.
A segment graph provides a two-dimensional visual representation of
the network. Nodes are displayed as icons on a ring, with traffic between
the nodes represented by lines of various thickness and color.
You can see information about a node or line by clicking on the node or
line to display its label. Click again to hide the label. To display a label
temporarily, use mouse button 2 to click on a node or line.
A line’s label shows two data values—one for each traffic direction. The
label’s top number reflects the “downhill” direction, that is, the value for
traffic originating with the node closest to the top of the graph traveling
to the node closest to the bottom of the graph. When the nodes are at the
same horizontal level, the label’s top number shows the value for traffic
originating with the node closest to the left of the graph traveling to the
node closest to the right of the graph. The label’s bottom number shows
the value for the opposite direction.
Figure 60 on page 273 shows a sample Conversation segment graph.
When you view traffic as a segment graph, you can manipulate the graph
in several ways that are not available with the other graph types. For
details, refer to page 299.
See Also “To change a graph’s appearance” on page 299.