
User`s guide


Load Monitor
Displaying Load
5967–9446 269
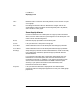
Figure 58 shows that at time interval 06/20 15:30:00 – 16:00:00, source
node sun-train7 was communicating with sun-train3, sun-train6,
sun-train8, sun-train5, and other destination nodes. Note the dashed
lines, graph titles, and Zoom focus point description.
Figure 58 Sample Zoom View: Time ➞ Source ➞ Destination
Graph title area and
dashed lines indicate
the current Zoom
focus points
Note the Zoom focus
points for source
node sun-train7 and
destination node
sun-train3
Zoom path and
current focus points
Zoom Layout is
This property is
discussed on
page 298