
User`s guide


Load Monitor
Displaying Load
5967–9446 261
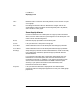
Figure 56 View Window: Source and Time Graphs, continued
Current data source
(Live, Archive)
Shows the number of
selected data points in
this graph and the
total number for which
statistics are available
Average
Utilization % for
the data points
shown in the
graph
Legend (at bottom of
graph) shows current
graphical fields:
Utilization, Total
Errors, Multicasts,
and Broadcasts
Graph scale
Data values for
graphical fields
are shown as a
line graph
For details on:
• Changing the data source, see
pages 256 and 336
• Choosing the type of graph (bar, plot,
etc.), see page 299
• Modifying the graph scale, see
page 301
• Displaying fewer or more items in the
graph area (e.g., more data points),
see page 276
• Choosing the graphical and tabular
fields, see page 289