
User`s guide


Load Monitor
Displaying Load
260 5967–9446
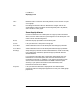
Figure 56 View Window: Source and Time Graphs
Current data source
(Live, Archive)
Shows the number of
selected items in this
graph and the total
number for which
statistics are available
Average for the sort
field (Octets), based
on the items shown
Legend (at bottom of
graph) shows current
graphical fields
(Octets, Total Errors)
and unit type
(Percentage)
Column to the left of
Y axis reflects current
tabular fields (Octets)
Graph scale
Node names are
shown when they can
be resolved
Data values for
graphical fields are
shown as a bar graph
For details on:
• Changing the data source, see
pages 256 and 336
• Choosing the type of graph (bar, plot,
etc.), see page 299
• Filtering the displayed items, see
page 295
• Displaying fewer or more items in the
graph area (e.g., more bars), see
page 276
• Choosing the graphical and tabular
fields, see page 289
• Selecting the sort field and sort type,
see page 293
• Changing the unit type, see page 301
• Modifying the graph scale, see
page 301
• Choosing whether to display node
names or numeric addresses, see
page 289