
User`s guide


Reporter
Component Health Graphs
5967–9446 117
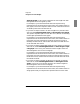
Figure 19 Component Health: Parameters and Sample Graph
Specify a time range
relative to when the
report is generated or
an absolute time
(shown on page 77)
Set which days
to include when
calculating data
values
Indicate whether
to restrict the
data to certain
hours
Choose which study to
use
Click this button to
update the number of
data points based on
the current settings
This example graphs values for Utilization % and Total Errors for the period
ending yesterday and going back five days, based on the 30-minute study.
Choose the
Component Category
Available statistics
Double-click to move a
statistic to the bottom
box
You can also highlight a statistic
and push Select to move the
statistic to the other box
To remove a statistic, click its
name in the bottom box and push
Remove
Sash lets you control the relative
height of the two boxes
Statistics that will be
graphed are shown
here
For each statistic,
select the multiplier to
use when displaying
its values
For a list of available statistics,
see page 119